Issue Date: Monday, July 6th, 2020
Issue Time: 9:15AM MDT
Summary:
With a gradual drying of the atmosphere, rainfall coverage and intensity took a step downward on Sunday. Nonetheless, scattered showers and thunderstorms were still abundant over certain regions like the Front Range, Central Mountains, San Juan Mountains and Southeast Mountains. Although storms were higher based, compared to Saturday, they were still able to deliver some short-term heavy rainfall. Amounts up to 0.40 inches, typically over a 10-15 minute period, were common mainly east of the Continental Divide. There were two areas that got more: first, a very isolated storms in Fremont County dropped just over 1.0 inch in less than 1 hour. A CoCoRaHS gage reported 1.07 inches this morning, which appears to be in the most intense part of the storm. Second, in Baca County, right along the Kansas border, a few slow moving cells dropped 1.0 to 1.5 inches of estimate rainfall. In both cases of the heavier rainfall, the areal coverage was too low to cause any flooding concerns.
In other news, the state enjoyed its last day of near normal temperatures on Sunday as a prolonged intense heat wave is expected to start today.
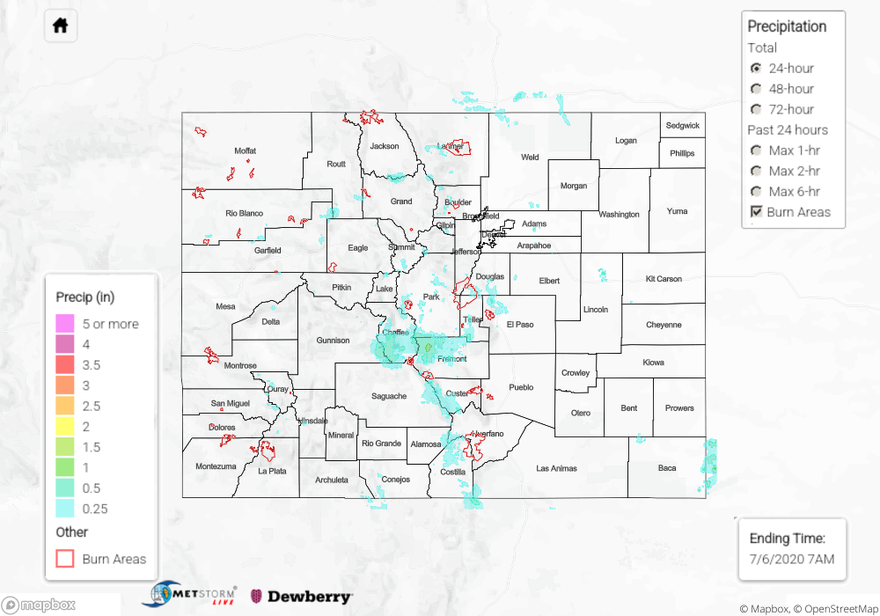
Flooding was not reported on Sunday. For precipitation estimates in your neighborhood over the last 24 to 72-hours, scroll down to the State Precipitation Map below.
Click Here For Map Overview