SPM 07-15-2020: Heavy Rain and Severe Thunderstorms Roll Through Southeast Colorado

Issue Date: Wednesday, July 15th, 2020
Issue Time: 10:40AM MDT

Summary:

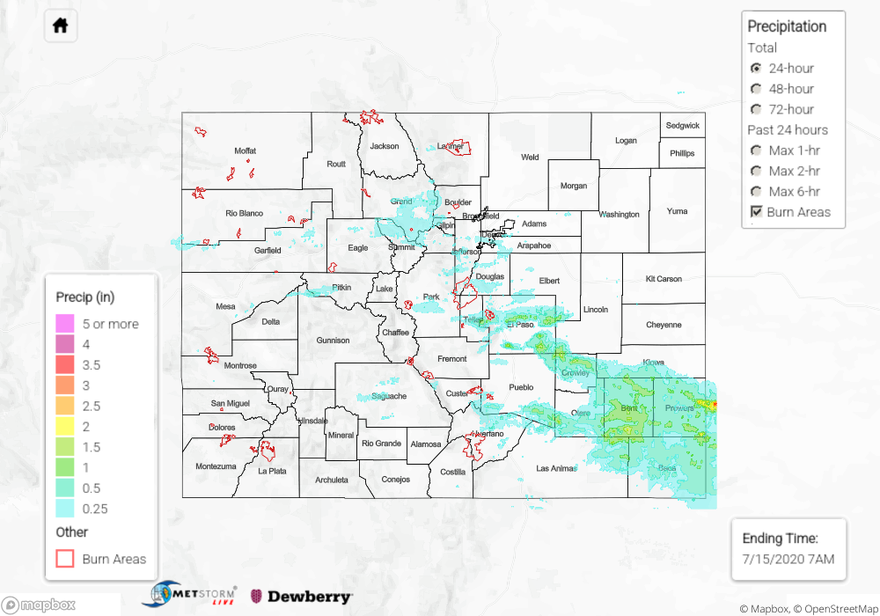
Severe thunderstorms fired over the mountains just west of Colorado Springs and moved southeast through the Southeast Plains yesterday bringing with them heavy rain, hail, and even a few tornado reports. Between noon and 5PM yesterday, storms trained across El Paso County and dropped up to 1.5 inches of rain just west of Colorado Springs. A heavy rain report was submitted on the northwest side of town indicating 1.5 inches of rain fell over 30 minutes, which is between a 25 and 50 year storm. Numerous CoCoRaHS and USGS rain gages corroborate that near or just under 1 inch of rain fell over the western side of the city and into the mountains just west. NWS Pueblo issued a Flash Flood Warning over this area at 3:56PM, but no flooding was reported as of this morning.

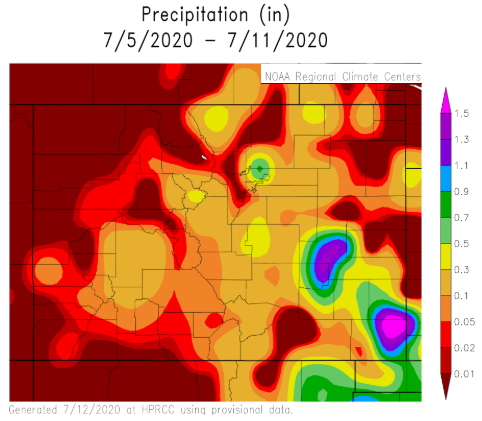
QPE indicates a swath of heavy rain totals between 1 and 2.5 inches from El Paso County southeastward through Bent and Prowers counties as severe thunderstorms tracked over this area from 4PM to 10PM. The highest report of 1.9 inches was from a trained spotter in southern Prowers County, and several CoCoRaHS and CoAgMET rain gages measured just over 1 inch of rainfall over the Southeast Plains. The severe storm over Bent country produced a tornado in Las Animas, CO, and thankfully no damage or injuries were reported. Although a large area of the Southeast Plains picked up over 1 inch of rain, no flooding was reported yesterday. This rainfall was very beneficial for the ongoing drought. Total rainfall amounts just across the border (east of Prowers) were estimated between 3 and 4 inches!

The western part of the state saw thunderstorms and showers over the high terrain, but another day where there was more wind that rainfall. Gusts up to 58 mph were recorded over the Grand Valley, Central Mountains, Northwest Slope, and Northern Mountains. Two isolated locations in the Central and San Juan Mountains picked up just over 0.7 inches of rain according to CoCoRaHS reports, but most locations reported up to 0.3 inches of rainfall. Some of the higher rain reports are likely due to some storms training over an area for an extended period, as indicated by radar. Showers lasted well into the night over the Southwest Slope and San Juan Mountains. No flooding was reported.

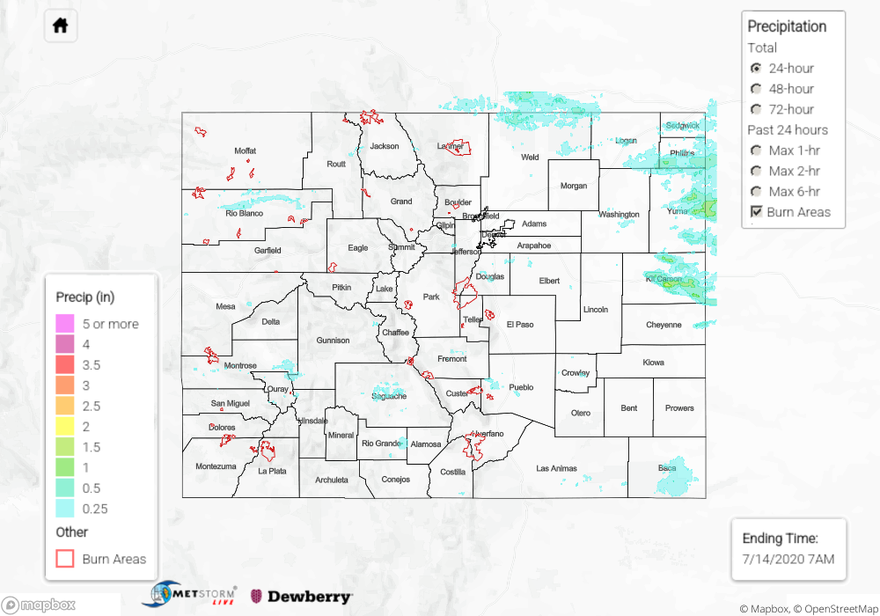
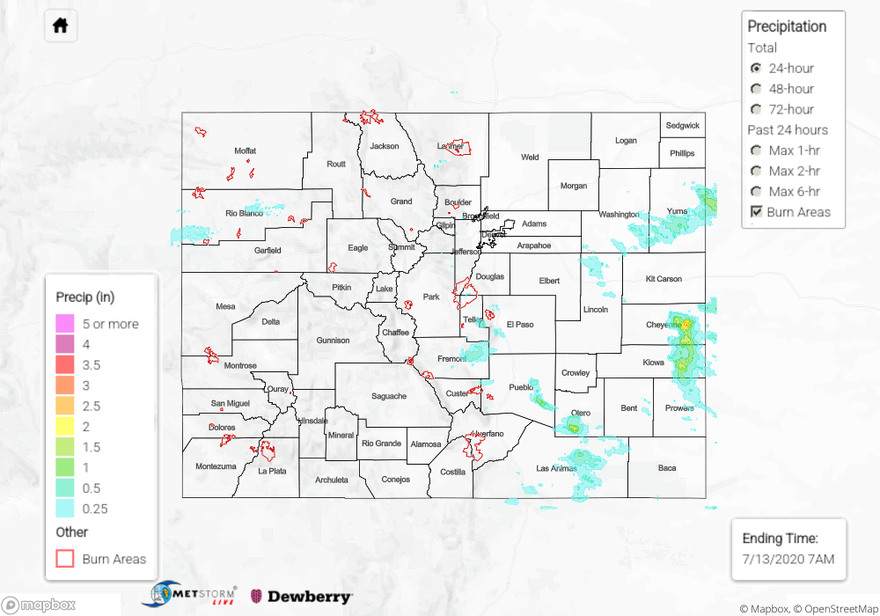
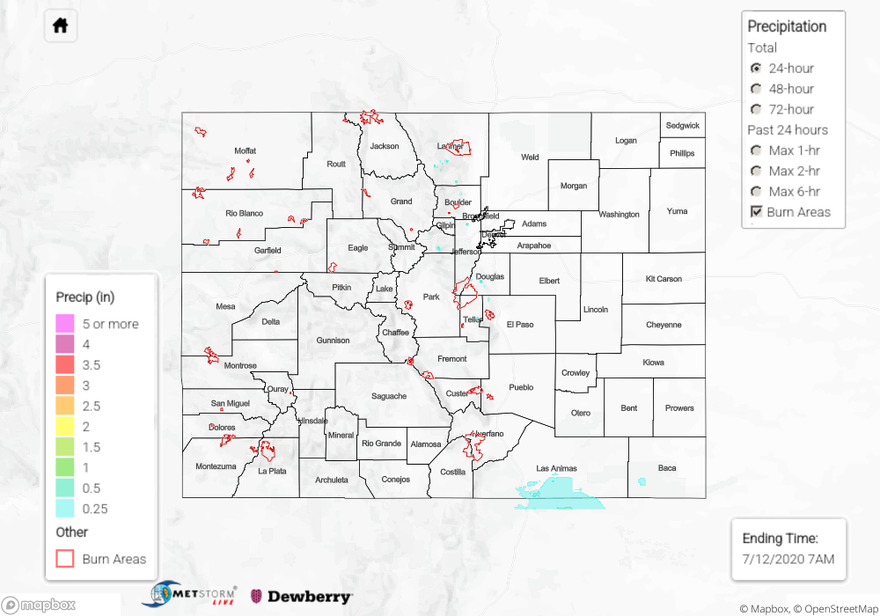
For rainfall estimates in your area over the last 24 to 72-hours, scroll down to the State Precipitation Map below.

Click Here For Map Overview

The map below shows radar-estimated, rainfall gage-adjusted Quantitative Precipitation Estimates (QPE) across Colorado. The map is updated daily during the operational season (May 1 – Sep 30) by 11AM. The following six layers are currently available: 24-hour, 48-hour and 72-hour total precipitation, as well as maximum 1-hour, 2-hour and 6-hour precipitation over the past 24 hour period (to estimate where flash flooding may have occurred). The 24-hour, 48-hour and 72-hour total precipitation contain bias corrections that are not disaggregated into the hourly estimates, so there will likely be some differences. The accumulation ending time is 7AM of the date shown in the bottom right corner. Also shown optionally are vulnerable fire burn areas (post 2012), which are updated throughout the season to include new, vulnerable burn areas. The home button in the top left corner resets the map to the original zoom.

SPM 07-14-2020: Scattered Storms Produce More Wind Than Rain

Issue Date: Tuesday, July 14th, 2020
Issue Time: 10:55AM MDT

Summary:

Thunderstorm outflow from numerous storms created wind gusts over 50 mph for much of northern Colorado yesterday, but not much in the way of rainfall. The true color satellite image below shows the wide coverage of storms by 6pm MDT yesterday. The more vigorous storms are evident in the true color satellite imagery over northeast Colorado. The border counties of the Northeast Plains were able to pick up the heavier rain totals due to the increased surface moisture, where dew points reached into the upper 50Fs. Back west in the lower surface moisture, more wind than rainfall was reported. The highest wind gusts were reported in Weld County where up to 77 mph winds caused power pole and building damage, which was associated with a severe thunderstorm that moved through the area between 4-5PM MDT. A couple strong wind gusts up to 60 mph were also reported in Montezuma and Las Animas counties in southern Colorado. These thunderstorm outflow winds were common due to dry sub-cloud air over these regions. Although NWS Grand Junction did not do soundings yesterday, it is inferred this area had the same inverted-V atmospheric sounding seen at Denver.

While flooding was not reported yesterday (as of this morning), much of the state picked up measurable rainfall from the west to east moving scattered thunderstorms. The heaviest rain totals occurred over the Northeast Plains, where up to 1.23 inches of rain accumulation was reported by a NWS rain gage. Just under 2 inches of rain was estimated by Metstorm over Kit Carson County. CoCoRaHS in the area, just north of the storm core, reported just under 1 inch of rainfall.

Although moisture was limited farther west along the Urban Corridor, up to 0.32 inches of rain fell at a rain gage just west of Fort Collins, and 0.38 inches of rain was reported by a CoCoRaHS observer in the foothills west of Denver. QPE and CoCoRaHS reports indicate that mountain regions with storms that tracked overhead picked up to 0.30 inches of rain. Even the San Luis Valley got in on the action! Up to 0.5 inches of rain fell along the western edge of the San Luis Valley.

Unfortunately, a new fire broke out near the town of Evergreen. It is named the Elephant Butte Fire, has burned 50 acres as of this morning, and prompted evacuations of more than 1000 homes. The smoke was visible from the Denver area yesterday. Luckily, no injuries or damaged structures have been reported yet, and cooler temperatures today and some rainfall last night will hopefully allow emergency workers to get it under control today.

For rainfall estimates in your area, check out our State Precipitation Map below.

Click Here For Map Overview

The map below shows radar-estimated, rainfall gage-adjusted Quantitative Precipitation Estimates (QPE) across Colorado. The map is updated daily during the operational season (May 1 – Sep 30) by 11AM. The following six layers are currently available: 24-hour, 48-hour and 72-hour total precipitation, as well as maximum 1-hour, 2-hour and 6-hour precipitation over the past 24 hour period (to estimate where flash flooding may have occurred). The 24-hour, 48-hour and 72-hour total precipitation contain bias corrections that are not disaggregated into the hourly estimates, so there will likely be some differences. The accumulation ending time is 7AM of the date shown in the bottom right corner. Also shown optionally are vulnerable fire burn areas (post 2012), which are updated throughout the season to include new, vulnerable burn areas. The home button in the top left corner resets the map to the original zoom.

SPM 07-13-2020: Isolated Flash Flooding over the Southeast Plains

Issue Date: Monday, July 13th, 2020
Issue Time: 10:55AM MDT

Summary:

Heavy rain fell in scattered thunderstorms over the Northeast Plains, Southeast Plains, and eastern Palmer Ridge regions yesterday. One particular storm had QPE estimated up to 3 inches over a couple hours between 7-9 PM MDT over Cheyenne Wells, CO. This caused Highway 385 to flood and prompted the NWS to issue a Flash Flood Warning at 7:07 PM MDT that was extended to last through this morning. CoCoRaHS 24-hr precipitation accumulations in Cheyenne Wells, CO were recorded between 1.50 inches and 1.80 inches, indicating the QPE map may contain a slight over-estimation of rainfall just to the east of town.

The “sandwich” satellite image (a combination of visible and infrared bands) from 07:26 PM MDT last night (see below) shows this intense thunderstorm with cold over-shooting cloud tops, indicating a vigorous updraft. The other thunderstorms over the eastern Palmer Ridge and Northeast Plains dropped hail up to 2.5 inches in diameter yesterday with numerous hail reports over 1.5 inches in Lincoln, Washington, and Yuma Counties. A few isolated areas in Pueblo, Otero, and Las Animas counties also saw decent accumulations, and QPE from thunderstorms was estimated at just over 2 inches of rain. No flooding was reported in the smaller storm cores as of this morning.

Back to the west, storms finally returned to the forecast with increased moisture over the region and large-scale dynamics helping to provide lift. Mostly, storms produced some very strong outflow winds (60 mph gusts) with the inverted-V soundings, but a few rounds of rainfall allowed some decent accumulations for the 24-hour period. Over the Northwest Slope, up to 0.5 inch of rain fell yesterday according to the QPE. A SNOTEL site in the Central Mountains recorded about 0.20 inches for the 24-hour period, and the highest CoCoRaHS observation was near Crested Butte (0.19 inches). Lastly, a wildfire broke out Sunday afternoon near Telluride and has currently burned about 60 acres. The cause of the fire is still unknown.

To find out how much rain fell near you over the last 24 hours, check out our State Precipitation Map below.

Click Here For Map Overview

The map below shows radar-estimated, rainfall gage-adjusted Quantitative Precipitation Estimates (QPE) across Colorado. The map is updated daily during the operational season (May 1 – Sep 30) by 11AM. The following six layers are currently available: 24-hour, 48-hour and 72-hour total precipitation, as well as maximum 1-hour, 2-hour and 6-hour precipitation over the past 24 hour period (to estimate where flash flooding may have occurred). The 24-hour, 48-hour and 72-hour total precipitation contain bias corrections that are not disaggregated into the hourly estimates, so there will likely be some differences. The accumulation ending time is 7AM of the date shown in the bottom right corner. Also shown optionally are vulnerable fire burn areas (post 2012), which are updated throughout the season to include new, vulnerable burn areas. The home button in the top left corner resets the map to the original zoom.

SPM 07-12-2020: Lone Storm Fires Over the Southern Raton Ridge

Issue Date: Sunday, July 12th, 2020
Issue Time: 10:25AM MDT

Summary:

It’s starting to feel like a broken record over here. Saturday was another hot and dry day statewide except for a lone storm that was able to break the cap over the Raton Ridge. The storm began shortly after 8PM on the backside of a larger area of convection just south of the border. This is a tough place to estimate rainfall, and there was quite the spread between QPE products. MetStorm had below 0.25 inches falling, AHPS estimated up to 0.75 inches, and MRMS estimated between 0.50 and 0.75 inches. The only observation close to the area was a CoCoRaHS station in Starkville, which reported no rainfall this morning.

As for high temperatures, it looks like temperature gauges along the southern border either came close to tying or beat their daily high record. Cortez topped out at 99F, Durango at 97F, and the Alamosa at 93F. Delta and Grand Junction were both over 100F again. It was a little cooler over eastern Colorado, but Pueblo and other areas of the Southeast Plains were still able to reach the century mark. Not much cloud cover until later in the evening and there wasn’t much wind in the afternoon, so it felt very hot. Below is a map that shows precipitation over the last 7 days. With the very hot temperatures from this heat wave and already dry soils, be prepared for a worsening US drought monitor map sometime soon. Fingers crossed the monsoon is on its way.

To see precipitation estimates in your neighborhood 24-hours ago, scroll down to the State Precipitation Map below.

Click Here For Map Overview

The map below shows radar-estimated, rainfall gage-adjusted Quantitative Precipitation Estimates (QPE) across Colorado. The map is updated daily during the operational season (May 1 – Sep 30) by 11AM. The following six layers are currently available: 24-hour, 48-hour and 72-hour total precipitation, as well as maximum 1-hour, 2-hour and 6-hour precipitation over the past 24 hour period (to estimate where flash flooding may have occurred). The 24-hour, 48-hour and 72-hour total precipitation contain bias corrections that are not disaggregated into the hourly estimates, so there will likely be some differences. The accumulation ending time is 7AM of the date shown in the bottom right corner. Also shown optionally are vulnerable fire burn areas (post 2012), which are updated throughout the season to include new, vulnerable burn areas. The home button in the top left corner resets the map to the original zoom.

SPM_20200712_snap