Issue Date: Sunday, July 12th, 2020
Issue Time: 10:25AM MDT
Summary:
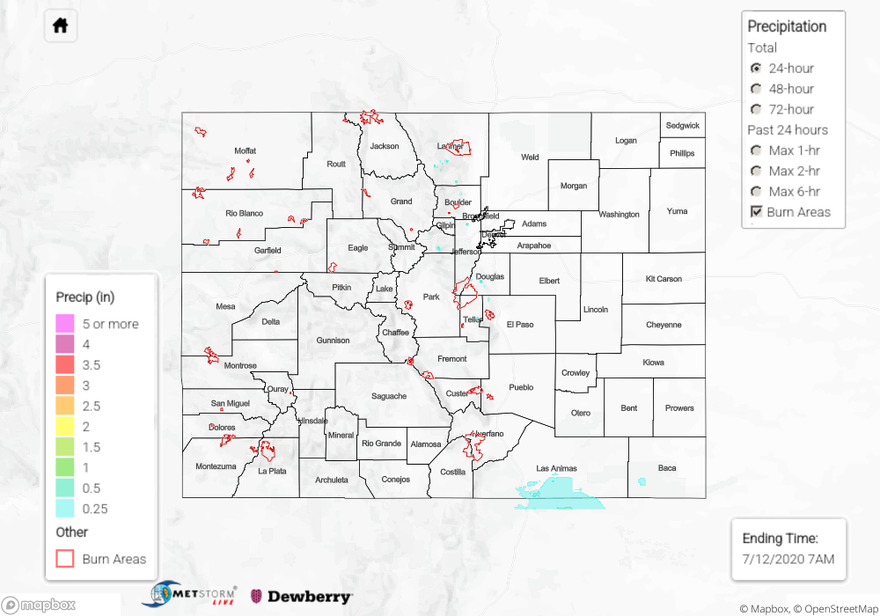
It’s starting to feel like a broken record over here. Saturday was another hot and dry day statewide except for a lone storm that was able to break the cap over the Raton Ridge. The storm began shortly after 8PM on the backside of a larger area of convection just south of the border. This is a tough place to estimate rainfall, and there was quite the spread between QPE products. MetStorm had below 0.25 inches falling, AHPS estimated up to 0.75 inches, and MRMS estimated between 0.50 and 0.75 inches. The only observation close to the area was a CoCoRaHS station in Starkville, which reported no rainfall this morning.
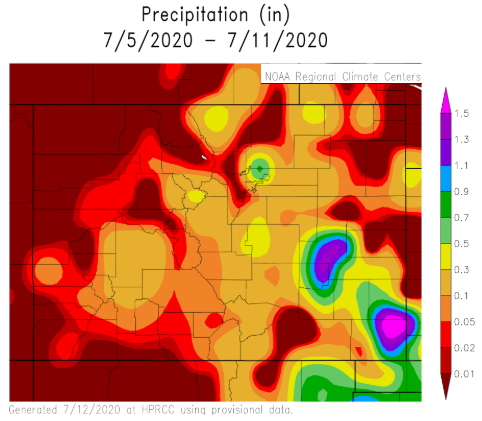
As for high temperatures, it looks like temperature gauges along the southern border either came close to tying or beat their daily high record. Cortez topped out at 99F, Durango at 97F, and the Alamosa at 93F. Delta and Grand Junction were both over 100F again. It was a little cooler over eastern Colorado, but Pueblo and other areas of the Southeast Plains were still able to reach the century mark. Not much cloud cover until later in the evening and there wasn’t much wind in the afternoon, so it felt very hot. Below is a map that shows precipitation over the last 7 days. With the very hot temperatures from this heat wave and already dry soils, be prepared for a worsening US drought monitor map sometime soon. Fingers crossed the monsoon is on its way.
To see precipitation estimates in your neighborhood 24-hours ago, scroll down to the State Precipitation Map below.
Click Here For Map Overview