Issue Date: Sunday, July 19th, 2020
Issue Time: 10:15AM MDT
Summary:
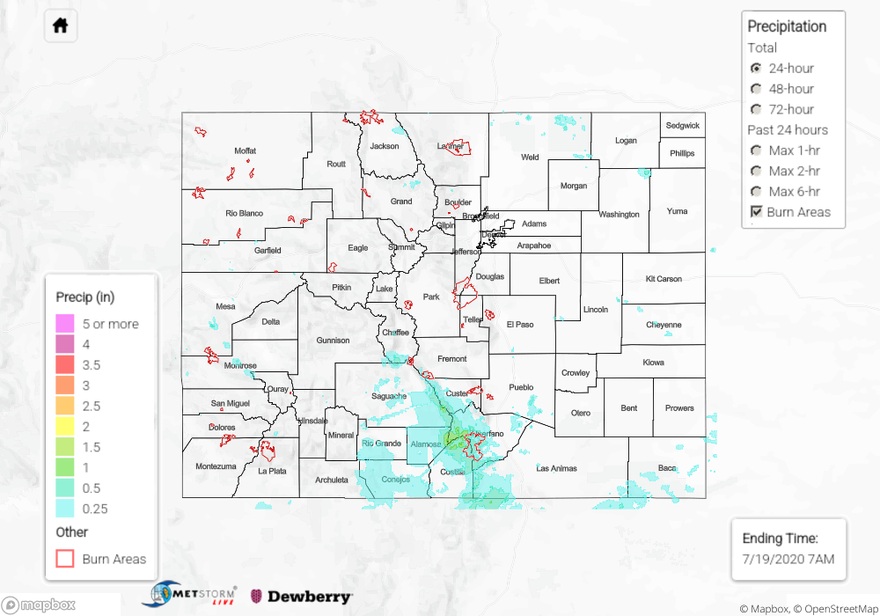
The plume of moisture that has been responsible for so much rainfall over western Colorado the last few days shifted slightly east. Not surprisingly, this also shifted the axis of heavier rainfall yesterday. The big rainfall story of the day was the interior of the San Luis Valley. CoCoRaHS in Alamosa ranged from 0.18 to 0.40 inches, and Monte Vista had about 0.25 inches reported. Just west of La Garita, a CoCoRaHS station picked up 1.09 inches. The QPE from MetStorm has a hard time with underestimations in that area, so hoping the new radar data will be added soon.
Looking at MRMS QPE, which does better over the area, QPE over Blanca Peak (Sand Dunes) was 2 inches. A nearby 2 inch CoCoRaHS station and 1.20 inch Whiskey Creek SNOTEL observation indicate there was some very heavy rainfall over the Southeast Mountains yesterday. This definitely confirms my suspicions that MetStorm underestimated rainfall totals over the San Juan Mountains for this last 3-day event. Two Flash Flood Warnings were issued for the Spring Creek burn area. The La Veta Mountain NWS gage recorded 0.18 inches and Weather Underground stations in the area recorded up to 0.25 inches. So far so good over this large, problematic burn area, but it really hasn’t seen a large rainfall event yet. Daily totals in Archuleta County were just over 1 inch, so that puts the 48-hour totals somewhere between 1.5 and 2 inches for the area! To put that in context, that’s a little over half of the typical rainfall totals they see during the month of July. Storms over the San Juan Mountains also produced pea sized hail. Further north, 55 mph gusts were recorded in Glenwood Springs and Silt, which makes since with rain totals dropping off to about 0.15 to 0.25 inches. Flooding was not reported on Saturday.
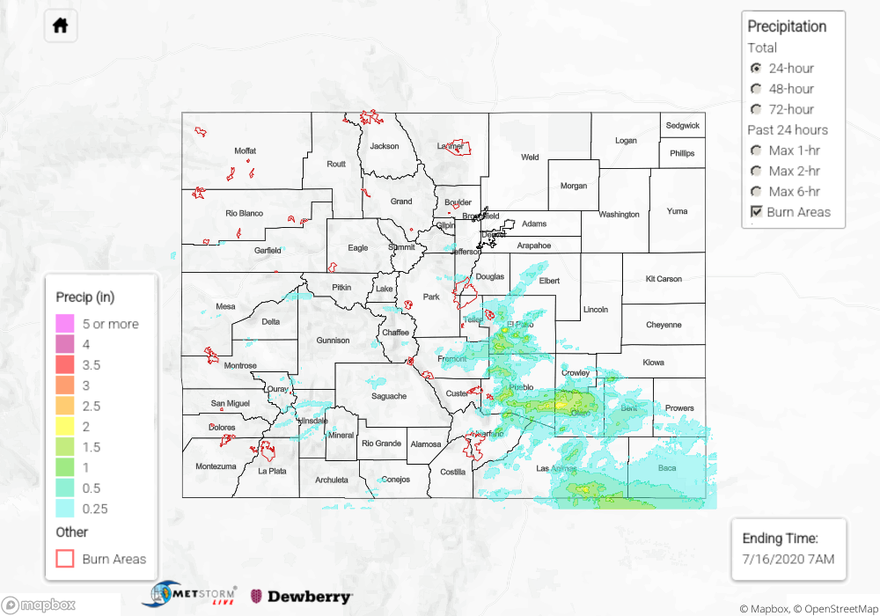
To see precipitation estimates over your area the last 24 to 72-hours, scroll down to the State Precipitation Map below.
Click Here For Map Overview