Issue Date: Saturday, July 18th, 2020
Issue Time: 10:45AM MDT
Summary:
It didn’t take long for storms to fire over the San Juan Mountains yesterday. The monsoonal moisture surge continued to hold high moisture over the area, and with a little heating and mid-level energy, storms kicked off just before 11AM. Storms were more pop-like, but persistent rainfall over the area allowed totals up 1 inch to accumulate over the southern San Juan Mountains. A USGS gage near Telluride recorded 0.22 inches, and CoCoRaHS/SNOTEL in the area were about the same. In the early evening, a storm tracked over Mancos and dropped 0.44 inches in about a 40-minute period. Around this time, a Flood Advisory was issued just north of the area with another storm over Dolores County. MRMS estimated just under 0.75 inches. Rainfall rates were low enough that major flooding was avoid, which was especially good for the 416 burn area. While rainfall activity was a little more scattered over the Northern and Central Mountains, some decent convection was able to form along the peaks and higher terrains. Delta and northern Montrose County had some heavy rainfall with totals estimated between 0.50 inches and 1 inch.
As storms moved east, the highest rainfall totals were again along the southern Continental Divide and Wet Mountains. The Copper Mountain ASOS gage recorded 0.26 inches. While the Southeast Mountains stayed mostly dry, there was some decent rainfall over the San Isabel National Forest and Sangre de Cristos. There was a little higher moisture over the Raton Ridge, and a gage outside Walsenburg recorded 0.33 inches. Not quite as much moisture over lower elevations north of the Raton Ridge, so the storms only produced some light outflow winds as they quickly dissipated when the moved off the mountains. Flooding was not reported on Friday.
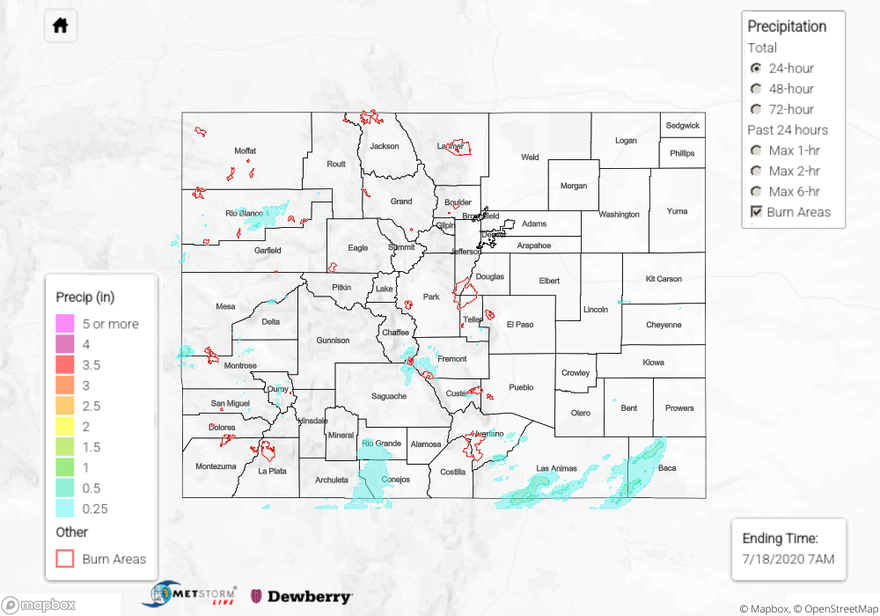
To see precipitation estimates over your area the last 24 to 72-hours, scroll down to the State Precipitation Map below.
Click Here For Map Overview