Issue Date: Thursday, July 16th, 2020
Issue Time: 11AM
Summary:
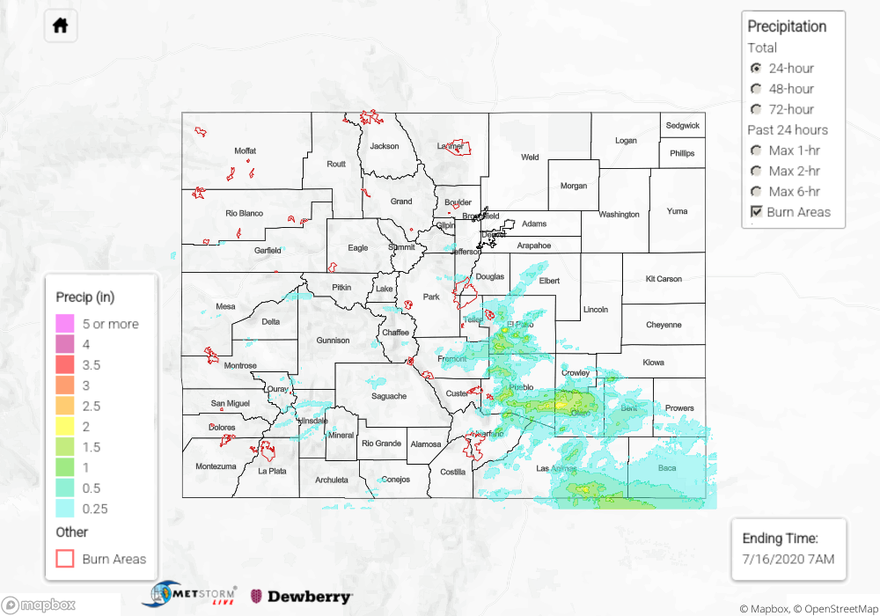
Mother Nature must have heard everyone, including us, worrying about drought in southeast Colorado. Enter another day of widespread heavy rainfall across the region. With plenty of moisture around, storms fired early over the higher terrain of the Central Mountains and Palmer Ridge and moved eastward, growing in scale. The highest measured rainfall in the state was likely the USGS Rod and Gun gauge, which measured 2.39 inches of rain in less than 1 hour. Even more impressively, 1.34 inches fell within a period of only 15 minutes, with 1.67 inches falling in a 20 minute span. This is between a 1 in 50 and 100 year event. Not surprisingly, the normally “flashy” Fountain Creek went from 200 cfs to almost 4,000 cfs in the span of a few hours (see below). Some flooding was reported in the area.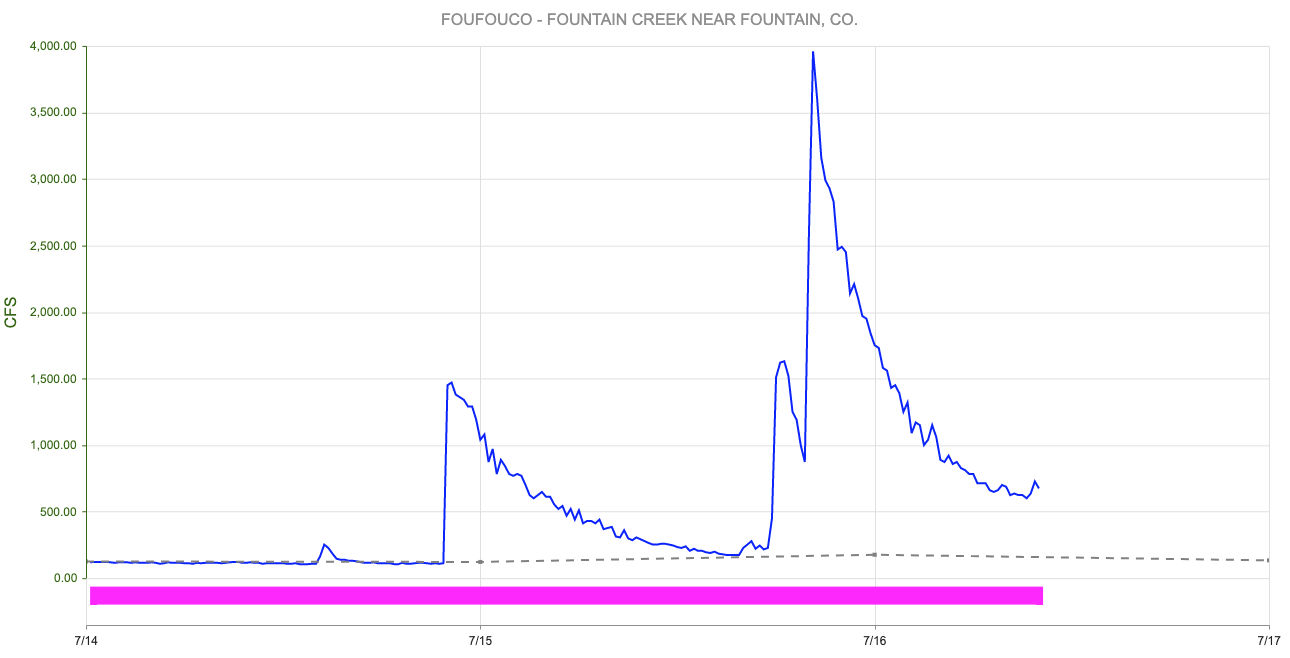
In addition to El Paso County, Fremont, Pueblo, Otero and Las Animas counties also received widespread heavy rainfall, leading to a few additional flooding reports. One was west of Pueblo, and another was in La Junta. Fortunately, no major riverine flooding was reported as flows were generally quite low to begin the day.
In addition to the heavy rainfall, there were numerous reports of large hail under the strongest storm cells. A handful of hail reports were received from the Palmer Ridge area, ranging from 1 to 2 inches in diameter.
For rainfall estimates in your area over the last 24 to 72-hours, scroll down to the State Precipitation Map below.
Click Here For Map Overview