SPM 08-08-2020: A Lone Storm for Baca County

Issue Date: Saturday, August 8th, 2020
Issue Time: 10:25AM MDT

Summary:

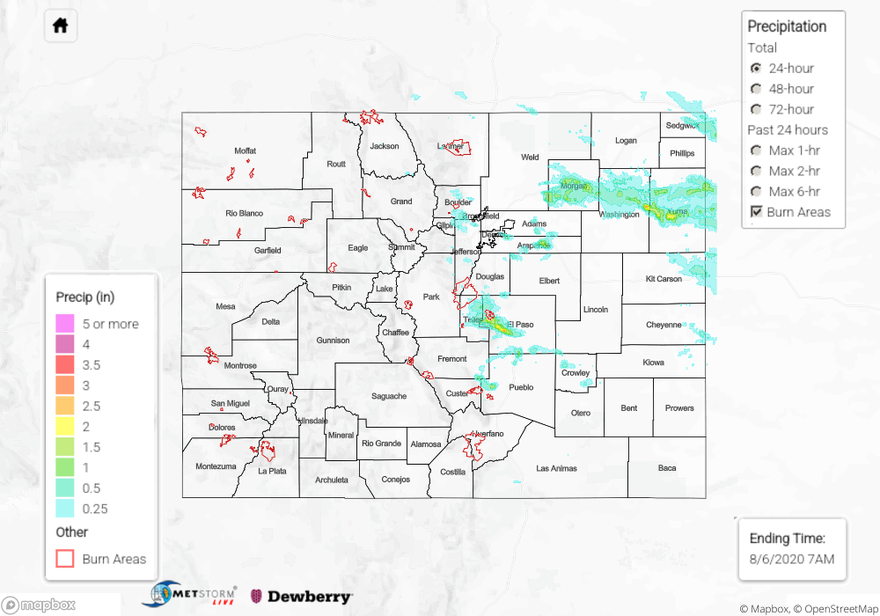
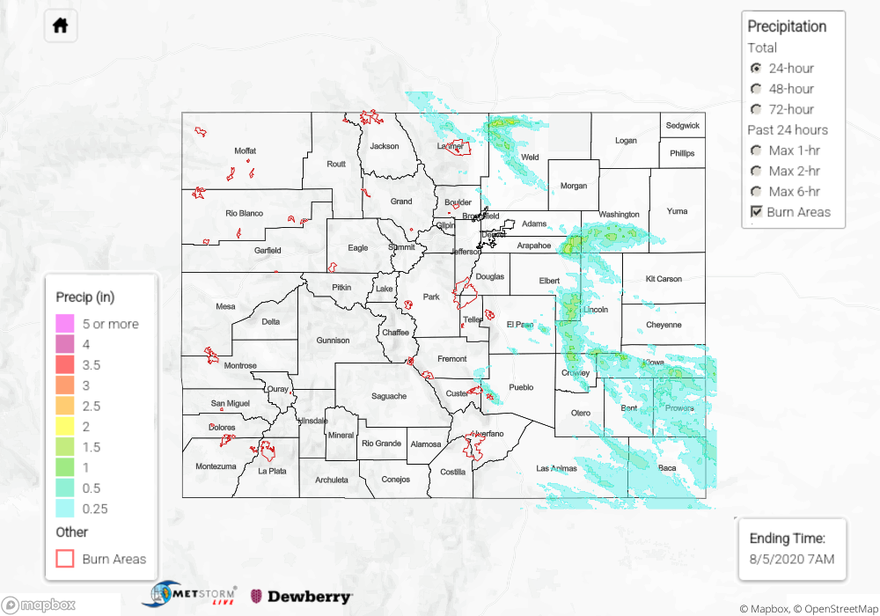
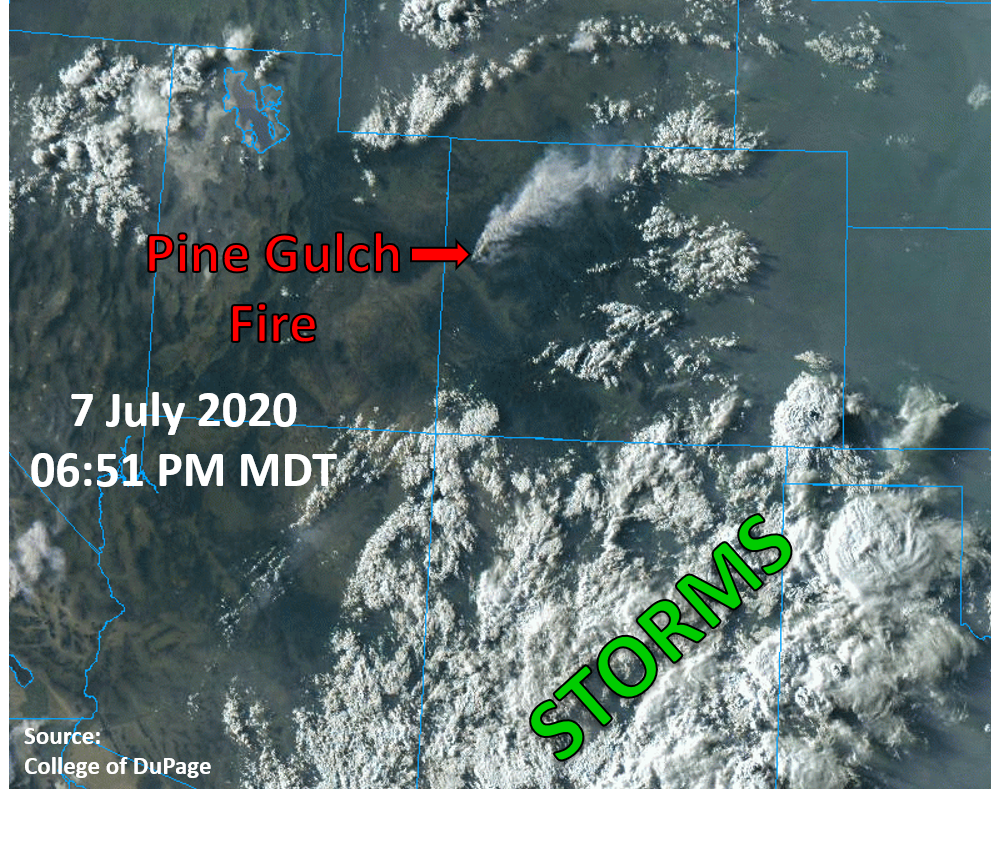
It stayed hot and dry for most of Colorado yesterday, but a lone thunderstorm moved through Baca County in far southeast Colorado and dropped the state’s only measurable rainfall. This isolated thunderstorm is visible on the true color satellite imagery last evening (see below), which shows storms largely stayed south of Colorado. QPE rain totals indicate up to 1.5 inches fell over Baca County, but limited coverage of rain gauges make this high total difficult to verify. The highest rain gauge total of 0.21 inches was submitted by a CoCoRaHS observer near Springfield. No flood or heavy rain reports were submitted near this storm. Check out the QPE map to see how isolated rain accumulation was from this storm.

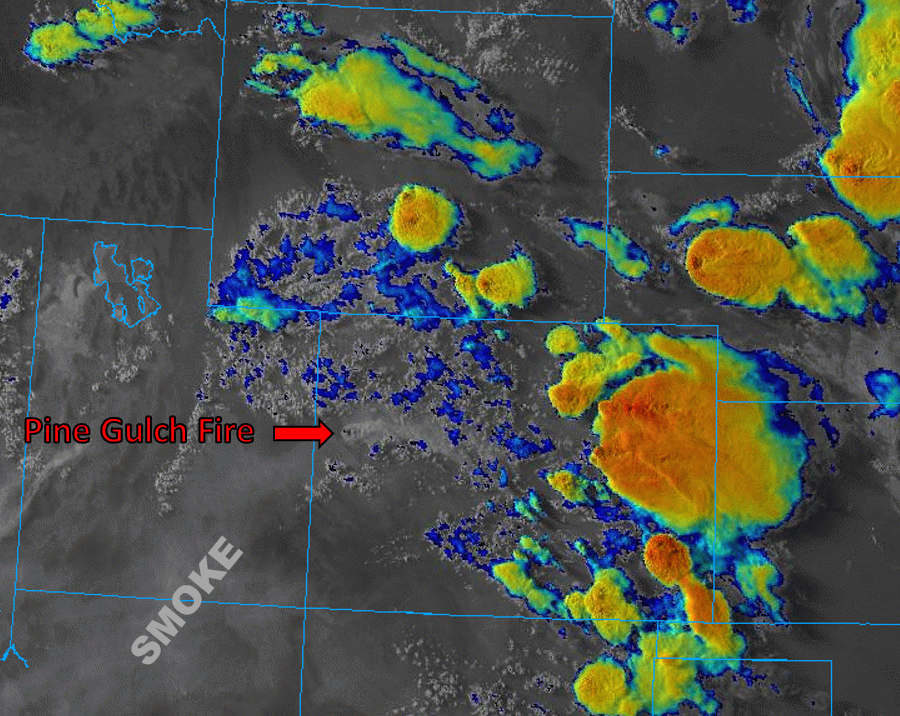
Unfortunately, dry southwesterly winds allowed the Pine Gulch Fire to grow once again. As of 11:30AM MDT yesterday, the fire was at 13,680 acres, but the fire has continued to grow since. The fire is easily identifiable on the satellite imagery yesterday (see image below), which is causing smoke to stream northeast over the state. Today will be similar to yesterday, so please pay attention to emergency management if you live near the area.

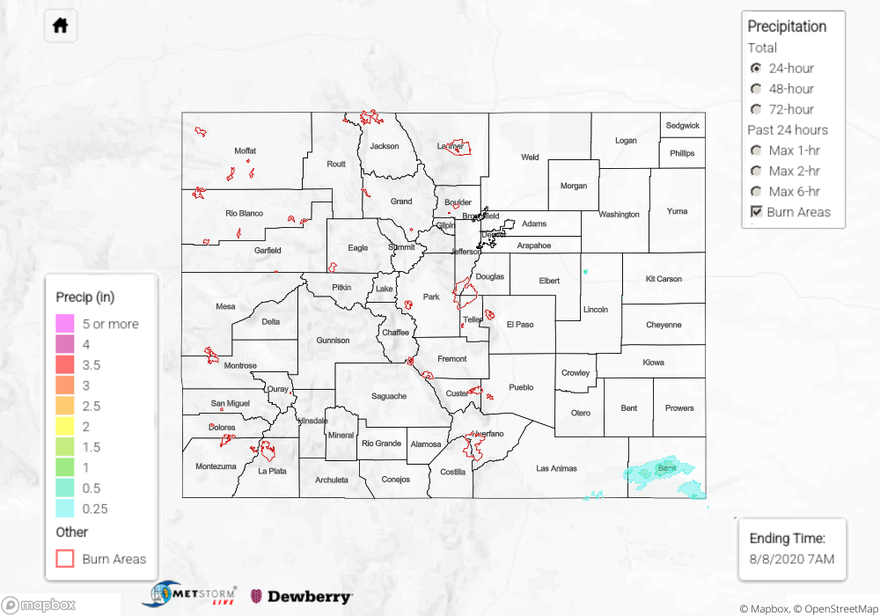
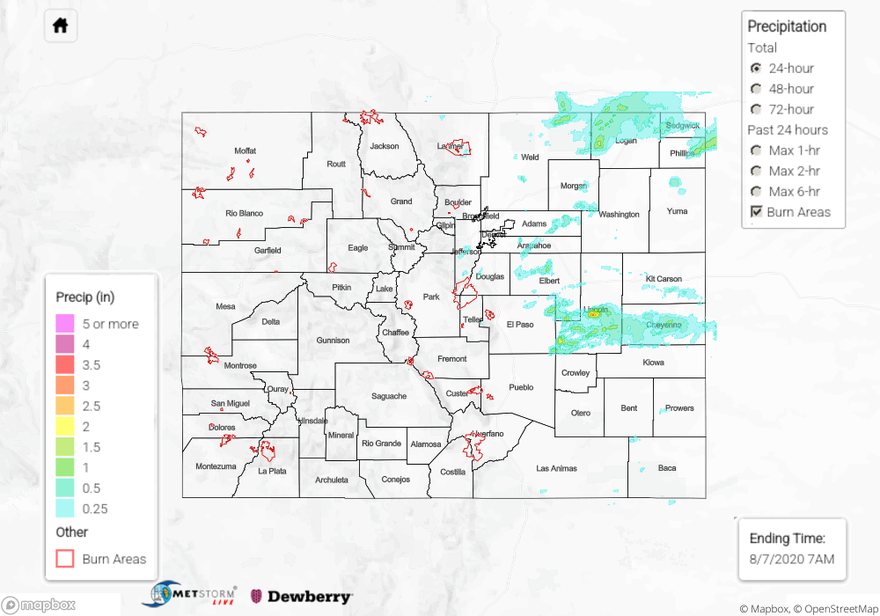
To see rain estimates near your location over the last 24, 48, or 72 hours, check out our State Precipitation Map below.

Click Here For Map Overview

The map below shows radar-estimated, rainfall gage-adjusted Quantitative Precipitation Estimates (QPE) across Colorado. The map is updated daily during the operational season (May 1 – Sep 30) by 11AM. The following six layers are currently available: 24-hour, 48-hour and 72-hour total precipitation, as well as maximum 1-hour, 2-hour and 6-hour precipitation over the past 24 hour period (to estimate where flash flooding may have occurred). The 24-hour, 48-hour and 72-hour total precipitation contain bias corrections that are not disaggregated into the hourly estimates, so there will likely be some differences. The accumulation ending time is 7AM of the date shown in the bottom right corner. Also shown optionally are vulnerable fire burn areas (post 2012), which are updated throughout the season to include new, vulnerable burn areas. The home button in the top left corner resets the map to the original zoom.

SPM 08-07-2020: Storms over the Eastern Plains Produce Damaging Winds and Local, Heavy Rainfall

Issue Date: Friday, August 7th, 2020
Issue Time: 9:45AM MDT

Summary:

A surface low over the western Southeast Plains helped pull moisture in on it’s east and north side, while it scoured out moisture to the east on its south side. This increased the chances for heavy rainfall over the Northeast Plains and Palmer Ridge, and decreased chances further south and over the Southeast Mountains. With less upper level support on Thursday, the severe storm and larger hail threat was lessened. Storms began to fire over the Front Range and Palmer Ridge by mid-afternoon, and they increased in intensity at about 104W or around Highway 71. Over the Palmer Ridge, storms produced wind gusts around 60mph and hail up to 1 inch. Outflow winds caused 4” diameter tree branches to snap near Byers. QPE was measured between a half inch and 3 inches in the cores of the storms. I’m not completely convinced that 3 inch value is real, but it is showing up on the MRMS, AHPS, and MetStorm QPE maps. I can’t find any other observations in the area, so it’s hard to confirm. In south, central Logan County, a 1.1 inch CoCoRaHS station was the highest observation for the day.

Another area of heavy rain was over Logan County with a storm report of 2.48 inches. Along with heavy rainfall, this storm produced a 59 mph wind gust and hail up to 1 inch. There may have been some hail contamination with the hail reports directly over the observation, and the hourly rainfall totals don’t look quite right at the gauge itself. QPE between 1.5 and 1.75 inches seems more fitting for storm and the duration of rainfall.

Back to the west over the mountains, 0.35 inches were measured by the Fort Collins mesonet with the scattered storms that formed. It was bone dry over the western slope, although clouds that formed near the Divide may have caused a sprinkle or two. Flooding was not reported on Thursday.

To see precipitation estimates over your area the last 24 to 72-hours, scroll down to the State Precipitation Map below.

Click Here For Map Overview

The map below shows radar-estimated, rainfall gage-adjusted Quantitative Precipitation Estimates (QPE) across Colorado. The map is updated daily during the operational season (May 1 – Sep 30) by 11AM. The following six layers are currently available: 24-hour, 48-hour and 72-hour total precipitation, as well as maximum 1-hour, 2-hour and 6-hour precipitation over the past 24 hour period (to estimate where flash flooding may have occurred). The 24-hour, 48-hour and 72-hour total precipitation contain bias corrections that are not disaggregated into the hourly estimates, so there will likely be some differences. The accumulation ending time is 7AM of the date shown in the bottom right corner. Also shown optionally are vulnerable fire burn areas (post 2012), which are updated throughout the season to include new, vulnerable burn areas. The home button in the top left corner resets the map to the original zoom.

SPM 08-06-2020: Severe Storms Produce Heavy Rain and Accumulating Hail in Colorado Springs

Issue Date: Thursday, August 6th, 2020
Issue Time: 11:00AM MDT

Summary:

Heavy rain and accumulating hail occurred over the Colorado Springs area yesterday as storms re-generated over the higher terrain west of the city and trained east over the area between 3PM and 9PM. Hail as large as 2 inches in diameter was reported to have caused damage to cars & windows and even accumulated enough to cover Interstate 25. Heavy rain up to 2.14 inches was reported by CoCoRaHS observers. A USGS rain gauge northwest of Manitou Springs reported 2.13 inches of rainfall, and four nearby USGS gauges reported over 1 inch of rain. The QPE map shows this heavy rainfall over western and southern parts of Colorado Springs, which indicates up to 3 inches fell over the 24 hour period. The Fountain Creek gage downstream of this heavy rainfall observed a rapid jump in gage height and 50-fold increase in flow from 70 cfs to 4000 cfs (see hydrograph below). Fountain Creek remains at streamflow levels above the 90th percentile near Pueblo as of this morning. Fortunately this heavy rainfall was not enough for the creek to reach flood stage, but flooding of roadways was reported in the Colorado Springs area. This flooding caused a debris slide near Manitou Springs and even caused cars to stall out near Fountain.

A cluster of more organized severe storms moved through Morgan, Washington, and Yuma counties yesterday, dropping up to 2.5 inches of rain according to the QPE map. CoCoRaHS observers reported up to 1.66 inches of rainfall from these severe storms, with near or over 1 inch reported in each county. A social media report indicated 2.5 inches of rain fell south of Yuma, CO, which is near where the QPE indicates the higher rain totals from these storms. Hail up to 0.88 inches in diameter and strong winds up to 63 mph also accompanied these storms. Flooding was not reported over this rural area as of this morning.

The Pine Gulch Fire north of Grand Junction grew quite a bit yesterday, up to around 12,000 acres as of late last night, and is only 5% contained. Unfortunately, continued dry and windy weather will continue over western Colorado today. Keep up to date on conditions and warnings from NWS Grand Junction if you live near the area.

For rainfall estimates in your area over the last 24, 48, and 72 hours, check out our State Precipitation Map below.

Click Here For Map Overview

The map below shows radar-estimated, rainfall gage-adjusted Quantitative Precipitation Estimates (QPE) across Colorado. The map is updated daily during the operational season (May 1 – Sep 30) by 11AM. The following six layers are currently available: 24-hour, 48-hour and 72-hour total precipitation, as well as maximum 1-hour, 2-hour and 6-hour precipitation over the past 24 hour period (to estimate where flash flooding may have occurred). The 24-hour, 48-hour and 72-hour total precipitation contain bias corrections that are not disaggregated into the hourly estimates, so there will likely be some differences. The accumulation ending time is 7AM of the date shown in the bottom right corner. Also shown optionally are vulnerable fire burn areas (post 2012), which are updated throughout the season to include new, vulnerable burn areas. The home button in the top left corner resets the map to the original zoom.

SPM 08-05-2020: Severe Storms Bring Heavy Rain to Plains, Pine Gulch Fire Burns in the West

Issue Date: Wednesday, August 5th, 2020
Issue Time: 11:00AM MDT

Summary:

The QPE map this morning shows that several strong thunderstorms were able to generate rain totals over 1 inch over the northern Urban Corridor, Palmer Ridge, and Northeast/Southeast Plains. A CoCoRaHS observer reported 1.53 inches of 24-hour rainfall near the town of Carr, along the northern Urban Corridor. Hail and flooding was also indicated by the comments from this observer. A Weather Underground station south of Carr also picked up 1.46 inches of rain over the course of the afternoon, indicating the 1.5 inch max QPE values over this area may be realistic. Radar loops show several rounds of re-generating storms moving over this area of eastern Larimer and western Weld counties between 2PM and 7PM yesterday, which prompted a couple Flood Advisories to be issued by NWS Boulder for small streams and arroyo flooding. Hail up to 2 inches in diameter was also reported with these northern storms.

Strong storms also produced heavy rain over eastern Arapahoe and southern Washington counties in the Northeast Plains. These storms can be seen in the visible + infrared satellite image below (06:46PM MDT). QPE indicates up to 2 inches of rain fell from these storms. Limited rain gauges are in this area, but the closest report from southwest Washington County was 0.96 inches (CoCoRaHS).

If you were wondering why the views along the Front Range have been so hazy, the 5000+ acre Pine Gulch Fire north of Grand Junction is likely the cause. The smoke from this fire can be seen streaming east in the satellite image below. Unfortunately limited rainfall is forecast for the area to help with containment efforts.

For rainfall totals in your area over the last 24 hours, check out our State Precipitation Map below.

Click Here For Map Overview

The map below shows radar-estimated, rainfall gage-adjusted Quantitative Precipitation Estimates (QPE) across Colorado. The map is updated daily during the operational season (May 1 – Sep 30) by 11AM. The following six layers are currently available: 24-hour, 48-hour and 72-hour total precipitation, as well as maximum 1-hour, 2-hour and 6-hour precipitation over the past 24 hour period (to estimate where flash flooding may have occurred). The 24-hour, 48-hour and 72-hour total precipitation contain bias corrections that are not disaggregated into the hourly estimates, so there will likely be some differences. The accumulation ending time is 7AM of the date shown in the bottom right corner. Also shown optionally are vulnerable fire burn areas (post 2012), which are updated throughout the season to include new, vulnerable burn areas. The home button in the top left corner resets the map to the original zoom.