Issue Date: Wednesday, August 5th, 2020
Issue Time: 11:00AM MDT
Summary:
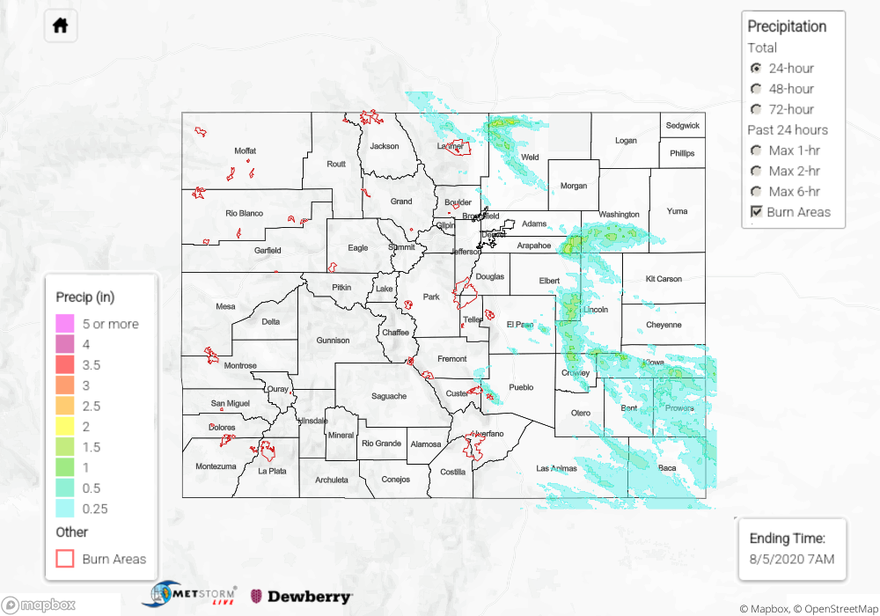
The QPE map this morning shows that several strong thunderstorms were able to generate rain totals over 1 inch over the northern Urban Corridor, Palmer Ridge, and Northeast/Southeast Plains. A CoCoRaHS observer reported 1.53 inches of 24-hour rainfall near the town of Carr, along the northern Urban Corridor. Hail and flooding was also indicated by the comments from this observer. A Weather Underground station south of Carr also picked up 1.46 inches of rain over the course of the afternoon, indicating the 1.5 inch max QPE values over this area may be realistic. Radar loops show several rounds of re-generating storms moving over this area of eastern Larimer and western Weld counties between 2PM and 7PM yesterday, which prompted a couple Flood Advisories to be issued by NWS Boulder for small streams and arroyo flooding. Hail up to 2 inches in diameter was also reported with these northern storms.
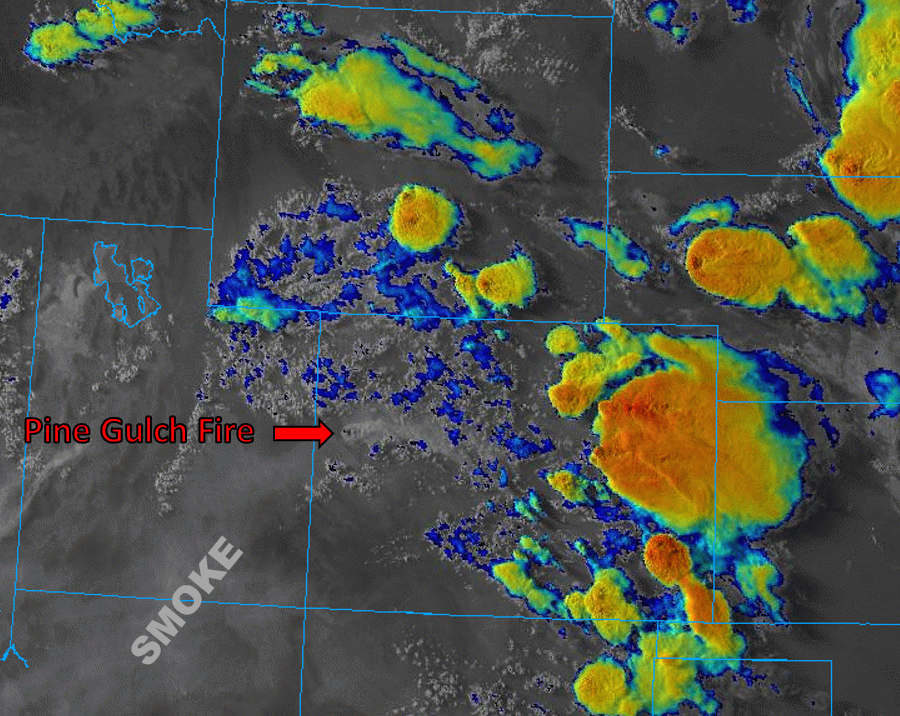
Strong storms also produced heavy rain over eastern Arapahoe and southern Washington counties in the Northeast Plains. These storms can be seen in the visible + infrared satellite image below (06:46PM MDT). QPE indicates up to 2 inches of rain fell from these storms. Limited rain gauges are in this area, but the closest report from southwest Washington County was 0.96 inches (CoCoRaHS).
If you were wondering why the views along the Front Range have been so hazy, the 5000+ acre Pine Gulch Fire north of Grand Junction is likely the cause. The smoke from this fire can be seen streaming east in the satellite image below. Unfortunately limited rainfall is forecast for the area to help with containment efforts.
For rainfall totals in your area over the last 24 hours, check out our State Precipitation Map below.
Click Here For Map Overview