Issue Date: Friday, August 7th, 2020
Issue Time: 9:45AM MDT
Summary:
A surface low over the western Southeast Plains helped pull moisture in on it’s east and north side, while it scoured out moisture to the east on its south side. This increased the chances for heavy rainfall over the Northeast Plains and Palmer Ridge, and decreased chances further south and over the Southeast Mountains. With less upper level support on Thursday, the severe storm and larger hail threat was lessened. Storms began to fire over the Front Range and Palmer Ridge by mid-afternoon, and they increased in intensity at about 104W or around Highway 71. Over the Palmer Ridge, storms produced wind gusts around 60mph and hail up to 1 inch. Outflow winds caused 4” diameter tree branches to snap near Byers. QPE was measured between a half inch and 3 inches in the cores of the storms. I’m not completely convinced that 3 inch value is real, but it is showing up on the MRMS, AHPS, and MetStorm QPE maps. I can’t find any other observations in the area, so it’s hard to confirm. In south, central Logan County, a 1.1 inch CoCoRaHS station was the highest observation for the day.
Another area of heavy rain was over Logan County with a storm report of 2.48 inches. Along with heavy rainfall, this storm produced a 59 mph wind gust and hail up to 1 inch. There may have been some hail contamination with the hail reports directly over the observation, and the hourly rainfall totals don’t look quite right at the gauge itself. QPE between 1.5 and 1.75 inches seems more fitting for storm and the duration of rainfall.
Back to the west over the mountains, 0.35 inches were measured by the Fort Collins mesonet with the scattered storms that formed. It was bone dry over the western slope, although clouds that formed near the Divide may have caused a sprinkle or two. Flooding was not reported on Thursday.
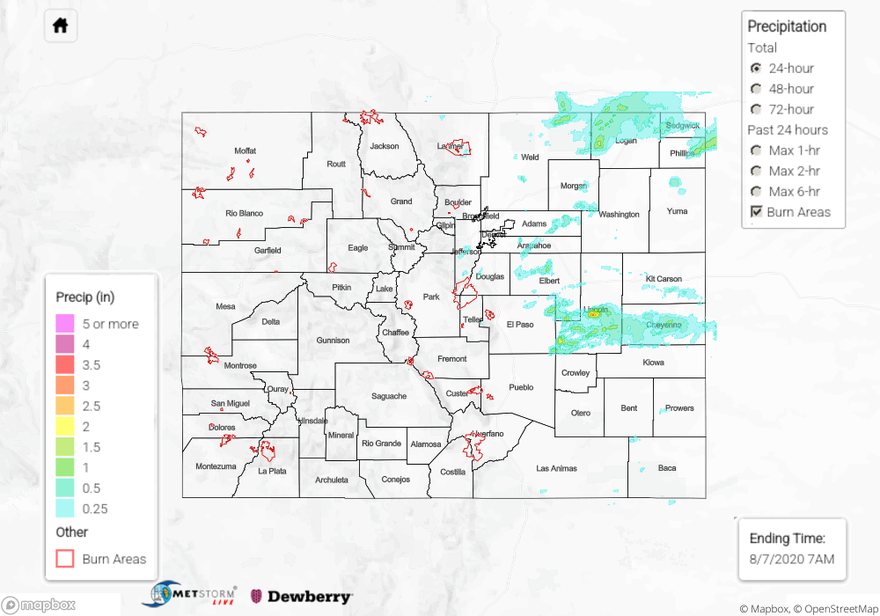
To see precipitation estimates over your area the last 24 to 72-hours, scroll down to the State Precipitation Map below.
Click Here For Map Overview