SPM 09-17-2020: No Precipitation, Just Smoke

Issue Date: Thursday, September 17th, 2020
Issue Time: 09:50AM MDT

Summary:

Yesterday we saw slightly less mountain clouds and most rain gauge networks are not reporting any measurable precipitation. There is one MesoWest automated gauge reporting 0.01 inch of rainfall over the last 24 hours in the San Juan Mountains, where the highest coverage of clouds existed yesterday.

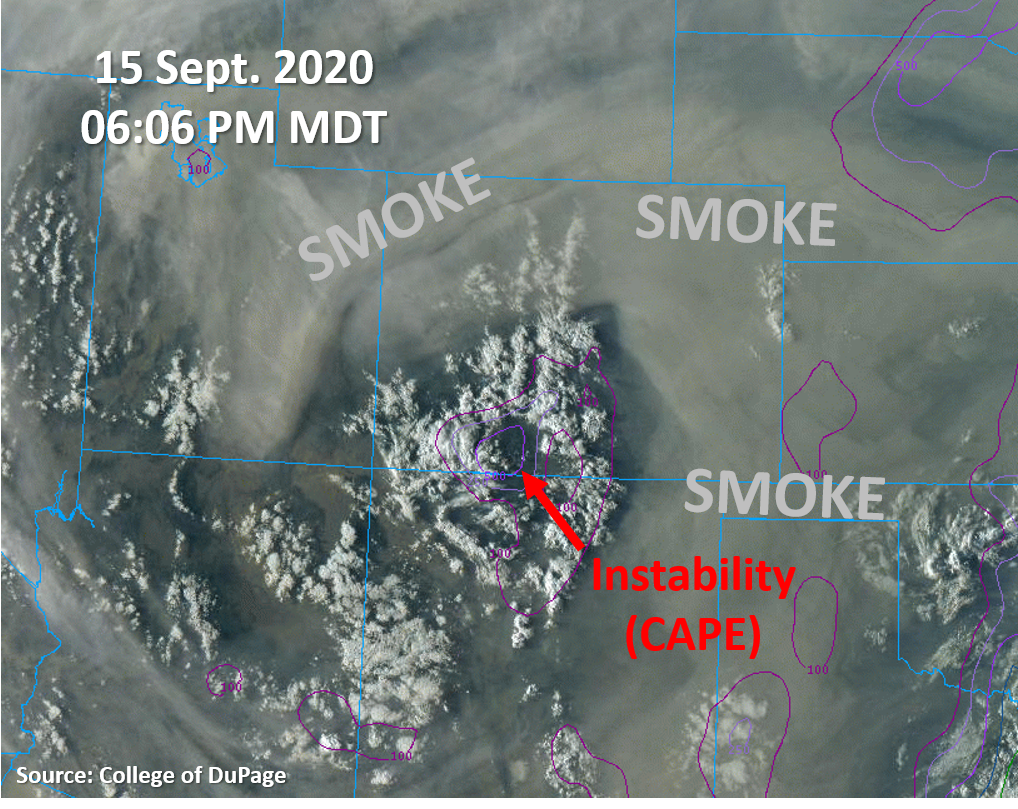
The biggest story yesterday was the increased smoke concentration over Colorado. This smoke was largely from the US West Coast wildfires, but some smoke from the newest Middle Fork wildfire near Steamboat Springs did contribute. This smoke created hazy skies across the Urban Corridor, and air quality jumped into the Unhealthy range. This smoke is still affecting the state this morning, and an Air Quality Alert issued by the NWS across the plains regions of eastern Colorado is still in effect through today.

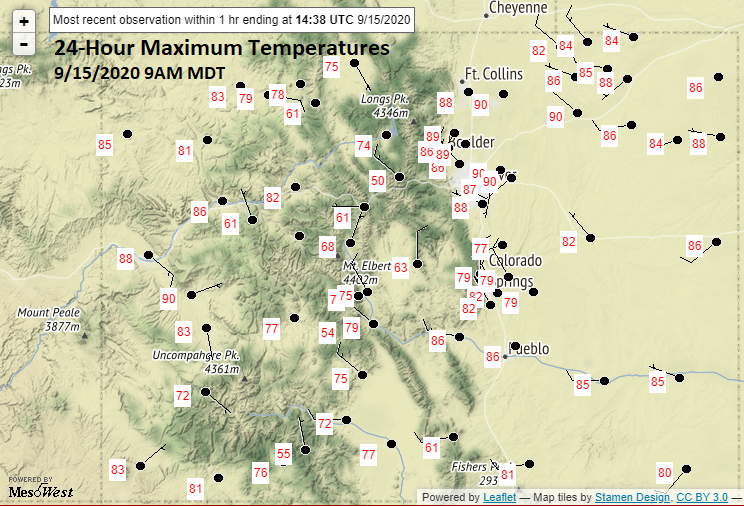
The combination of a weak cold front and the increased smoke kept temperatures cooler along the plains regions in eastern Colorado yesterday. Denver reported a high of 75F, which is 4F below average. Most locations along the Urban Corridor, Northeast Plains, and Palmer Ridge saw highs in the 70Fs. Temperatures rose into the 80Fs for locations in the Southeast Plains, with a high of 86F in La Junta and 83F in Pueblo, which is only up to 3F above normal.

Ongoing Colorado wildfires update (as of 9:45AM from InciWeb):
Middle Fork in the Park Range: 5,445 acres; 0% contained (jump in size with active fire behavior)
Cameron Peak in the Medicine Bow Mountains: 102,596 acres; 8% contained
Williams Fork in the Arapaho National Forest: 12,280 acres; 16% contained (slight increase in size; increased containment)

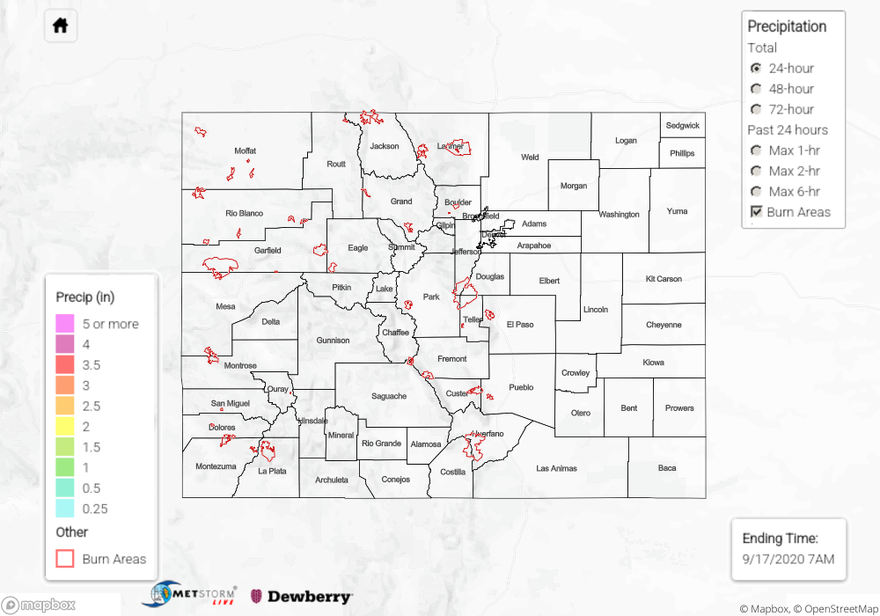
Not much to see in the 24 hour precipitation totals on our State Precipitation Map below as no significant rain occurred yesterday.

Click Here For Map Overview

The map below shows radar-estimated, rainfall gage-adjusted Quantitative Precipitation Estimates (QPE) across Colorado. The map is updated daily during the operational season (May 1 – Sep 30) by 11AM. The following six layers are currently available: 24-hour, 48-hour and 72-hour total precipitation, as well as maximum 1-hour, 2-hour and 6-hour precipitation over the past 24 hour period (to estimate where flash flooding may have occurred). The 24-hour, 48-hour and 72-hour total precipitation contain bias corrections that are not disaggregated into the hourly estimates, so there will likely be some differences. The accumulation ending time is 7AM of the date shown in the bottom right corner. Also shown optionally are vulnerable fire burn areas (post 2012), which are updated throughout the season to include new, vulnerable burn areas. The home button in the top left corner resets the map to the original zoom.

SPM 09-16-2020: Smoke Surrounds Mountain Clouds

Issue Date: Wednesday, September 16th, 2020
Issue Time: 09:55AM MDT

Summary:

Some clouds and weak showers developed over the mountains again yesterday with diurnal heating, but some clouds were already present over the San Juan Mountains by sunrise, indicating some increased mid-level moisture. These clouds eventually produced virga and a few sprinkles for some locations of the San Juan and Southeast Mountains. CoCoRaHS observers reported up to 0.07 inches of rain accumulation near Pagosa Springs, with only traces of precipitation further west along the southern San Juan Mountains and along the northern & eastern edges of the San Luis Valley. A couple automated weather stations from MesoWest reported 0.01 inches of rain along the southern San Juan Mountains. Overall, rain was very limited yesterday as it was dry for the majority of the state.

One interesting observation from yesterday is the “donut hole” in the smoke over Colorado, with the southwestern part of the state generally staying smoke-free. This is very evident in the true-color satellite image last evening (see image below). Interestingly, within this hole in the smoke coverage was the majority of the cloud cover and instability, as shown by overlaid convective available potential energy (CAPE) contours (purple lines in image below). With small differences in moisture across the state yesterday, the additional sunshine and diurnal heating over the southwestern mountains appears to have allowed more clouds and convective showers to develop. This shows the impact that smoke can have on keeping conditions dry by suppressing precipitation, especially in the absence of more large-scale lift when relying on convection is your only option for precipitation.

Ongoing Colorado wildfires update (as of 9:45AM from InciWeb):
Middle Fork in the Park Range: 4,795 acres; 0% contained
Cameron Peak in the Medicine Bow Mountains: 102,596 acres; 8% contained (increased containment)
Williams Fork in the Arapaho National Forest: 12,157 acres; 12% contained (increased containment)

Not much to see on our State Precipitation Map below as less than 0.25 inches of rain have fallen over the last few days.

Click Here For Map Overview

The map below shows radar-estimated, rainfall gage-adjusted Quantitative Precipitation Estimates (QPE) across Colorado. The map is updated daily during the operational season (May 1 – Sep 30) by 11AM. The following six layers are currently available: 24-hour, 48-hour and 72-hour total precipitation, as well as maximum 1-hour, 2-hour and 6-hour precipitation over the past 24 hour period (to estimate where flash flooding may have occurred). The 24-hour, 48-hour and 72-hour total precipitation contain bias corrections that are not disaggregated into the hourly estimates, so there will likely be some differences. The accumulation ending time is 7AM of the date shown in the bottom right corner. Also shown optionally are vulnerable fire burn areas (post 2012), which are updated throughout the season to include new, vulnerable burn areas. The home button in the top left corner resets the map to the original zoom.

SPM 09-15-2020: Above Average Temperatures Continue with Only Sprinkles Reported

Issue Date: Tuesday, September 15th, 2020
Issue Time: 9:30AM MDT

Summary:

Not much else to talk about other than the above average temperatures for mid-September with this ridging pattern. On Monday, some cloud cover formed over the mountains during the afternoon/evening hours and produce a few sprinkles, but observations are all below 0.05 inches. This was likely due to the dry surface layer increasing evaporation, since most of the moisture was in the mid-layers. Below (top) are the 24-hour maximum temperatures from NWS ASOS stations across the state. It’s been quite warm, and for comparison, I have the 24-hour maximum temperatures from last Wednesday morning (Tuesday’s highs). Just wanted to show what an impressive rebound it has been since last week’s snow storm and freeze. Highs will continue to stay above average until this weekend when the next Low pressure system moves onshore from the west. This next system will also help to reduce the near surface smoke that will likely build up over the next couple of days.

Ongoing Colorado wildfires update (as of 9:30AM from InciWeb):
Thankfully, the ongoing fires haven’t flared up with the warmer temperatures and drier conditions. The lack of wind has surly helped. Due to the high containment of the Pine Gulch and Grizzly Creek fires, they have been removed from this update. Those fires can still be tracked on InciWeb: https://inciweb.nwcg.gov/

Cameron Peak in the Medicine Bow Mountains: 102,596 acres; 4% contained
Williams Fork in the Arapaho National Forest: 12,157 acres; 10% contained

With precipitation estimates under 0.25 inches over the last 72-hours, the State Precipitation Map below looks blank.

Click Here For Map Overview

The map below shows radar-estimated, rainfall gage-adjusted Quantitative Precipitation Estimates (QPE) across Colorado. The map is updated daily during the operational season (May 1 – Sep 30) by 11AM. The following six layers are currently available: 24-hour, 48-hour and 72-hour total precipitation, as well as maximum 1-hour, 2-hour and 6-hour precipitation over the past 24 hour period (to estimate where flash flooding may have occurred). The 24-hour, 48-hour and 72-hour total precipitation contain bias corrections that are not disaggregated into the hourly estimates, so there will likely be some differences. The accumulation ending time is 7AM of the date shown in the bottom right corner. Also shown optionally are vulnerable fire burn areas (post 2012), which are updated throughout the season to include new, vulnerable burn areas. The home button in the top left corner resets the map to the original zoom.

SPM 09-14-2020: Continued Dry with A Few Mountain Sprinkles

Issue Date: Monday, September 14th, 2020
Issue Time: 09:40AM MDT

Summary:

Yesterday was another dry and warm day with some clouds forming over most mountaintops yet again. These clouds generally did not produce rainfall, except for a few showers over the San Juan Mountains where the only reported precipitation of 0.02 inches was reported by a CoCoRaHS observer near Ouray. A trace of rainfall was reported near Buena Vista in the Central Mountains as well.

Since precipitation looks to not be in the forecast for awhile, let’s take a look back at the precipitation received so far for the month of September. The image below shows total precipitation received so far in September 2020 (left) as well as how that compares to climatological normal (right). As you can see, much of the state has received over 1 inch of precipitation so far this month, with totals over 2 inches along the southern and central mountains. This beneficial precipitation is well above 100% of average for the month across these locations. However, some areas of Colorado did not benefit as much from the recent storm last week. The Northwest Slope received well under an inch of precipitation so far this month, so they are between 10% and 70% of normal for September so far. Hopefully some precipitation will be able to make up this deficit later this month. Note that these precipitation analyses are preliminary and will change as the month goes on. Keep an eye on the analyses at the PRISM Climate Group’s awesome website:
https://prism.oregonstate.edu/

Ongoing Colorado wildfires update (as of 9:30AM from InciWeb):
Middle Fork in the Park Range: 4,540 acres; 0% contained (new addition, started Sep. 6th)
Cameron Peak in the Medicine Bow Mountains: 102,596 acres; 4% contained
Williams Fork in the Arapaho National Forest: 12,157 acres; 10% contained
Grizzly Creek in Glenwood Canyon: 32,431 acres; 91% contained
Pine Gulch north of Grand Junction: 139,007 acres; 95% contained

For rainfall estimates in your area over the last 24, 48, and 72 hours, check out our State Precipitation Map below.

Click Here For Map Overview

The map below shows radar-estimated, rainfall gage-adjusted Quantitative Precipitation Estimates (QPE) across Colorado. The map is updated daily during the operational season (May 1 – Sep 30) by 11AM. The following six layers are currently available: 24-hour, 48-hour and 72-hour total precipitation, as well as maximum 1-hour, 2-hour and 6-hour precipitation over the past 24 hour period (to estimate where flash flooding may have occurred). The 24-hour, 48-hour and 72-hour total precipitation contain bias corrections that are not disaggregated into the hourly estimates, so there will likely be some differences. The accumulation ending time is 7AM of the date shown in the bottom right corner. Also shown optionally are vulnerable fire burn areas (post 2012), which are updated throughout the season to include new, vulnerable burn areas. The home button in the top left corner resets the map to the original zoom.