Issue Date: Monday, September 14th, 2020
Issue Time: 09:40AM MDT
Summary:
Yesterday was another dry and warm day with some clouds forming over most mountaintops yet again. These clouds generally did not produce rainfall, except for a few showers over the San Juan Mountains where the only reported precipitation of 0.02 inches was reported by a CoCoRaHS observer near Ouray. A trace of rainfall was reported near Buena Vista in the Central Mountains as well.
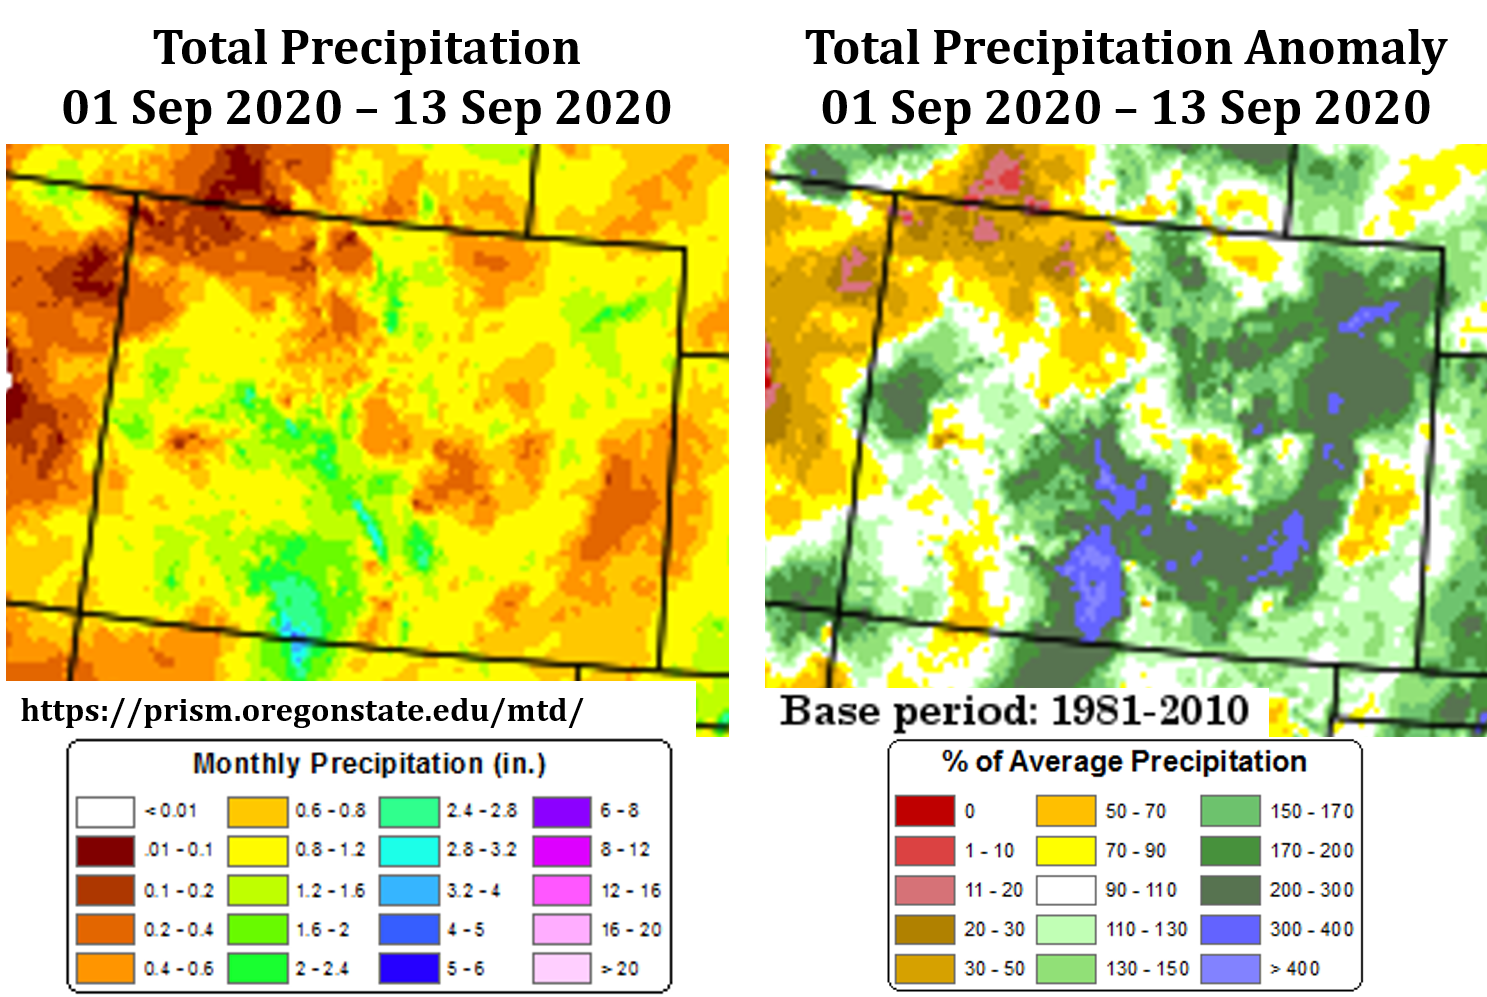
Since precipitation looks to not be in the forecast for awhile, let’s take a look back at the precipitation received so far for the month of September. The image below shows total precipitation received so far in September 2020 (left) as well as how that compares to climatological normal (right). As you can see, much of the state has received over 1 inch of precipitation so far this month, with totals over 2 inches along the southern and central mountains. This beneficial precipitation is well above 100% of average for the month across these locations. However, some areas of Colorado did not benefit as much from the recent storm last week. The Northwest Slope received well under an inch of precipitation so far this month, so they are between 10% and 70% of normal for September so far. Hopefully some precipitation will be able to make up this deficit later this month. Note that these precipitation analyses are preliminary and will change as the month goes on. Keep an eye on the analyses at the PRISM Climate Group’s awesome website:
https://prism.oregonstate.edu/
Ongoing Colorado wildfires update (as of 9:30AM from InciWeb):
Middle Fork in the Park Range: 4,540 acres; 0% contained (new addition, started Sep. 6th)
Cameron Peak in the Medicine Bow Mountains: 102,596 acres; 4% contained
Williams Fork in the Arapaho National Forest: 12,157 acres; 10% contained
Grizzly Creek in Glenwood Canyon: 32,431 acres; 91% contained
Pine Gulch north of Grand Junction: 139,007 acres; 95% contained
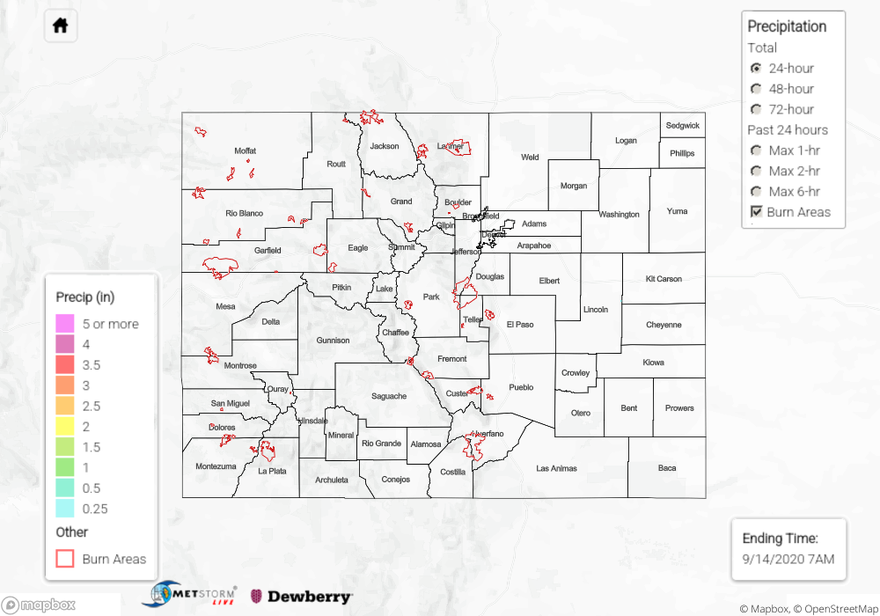
For rainfall estimates in your area over the last 24, 48, and 72 hours, check out our State Precipitation Map below.
Click Here For Map Overview