Issue Date: Thursday, September 17th, 2020
Issue Time: 09:50AM MDT
Summary:
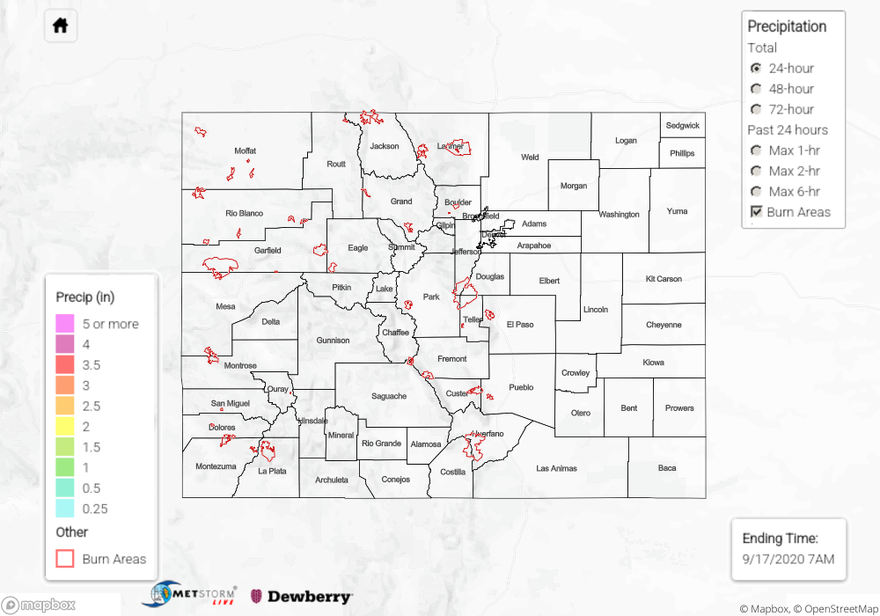
Yesterday we saw slightly less mountain clouds and most rain gauge networks are not reporting any measurable precipitation. There is one MesoWest automated gauge reporting 0.01 inch of rainfall over the last 24 hours in the San Juan Mountains, where the highest coverage of clouds existed yesterday.
The biggest story yesterday was the increased smoke concentration over Colorado. This smoke was largely from the US West Coast wildfires, but some smoke from the newest Middle Fork wildfire near Steamboat Springs did contribute. This smoke created hazy skies across the Urban Corridor, and air quality jumped into the Unhealthy range. This smoke is still affecting the state this morning, and an Air Quality Alert issued by the NWS across the plains regions of eastern Colorado is still in effect through today.
The combination of a weak cold front and the increased smoke kept temperatures cooler along the plains regions in eastern Colorado yesterday. Denver reported a high of 75F, which is 4F below average. Most locations along the Urban Corridor, Northeast Plains, and Palmer Ridge saw highs in the 70Fs. Temperatures rose into the 80Fs for locations in the Southeast Plains, with a high of 86F in La Junta and 83F in Pueblo, which is only up to 3F above normal.
Ongoing Colorado wildfires update (as of 9:45AM from InciWeb):
Middle Fork in the Park Range: 5,445 acres; 0% contained (jump in size with active fire behavior)
Cameron Peak in the Medicine Bow Mountains: 102,596 acres; 8% contained
Williams Fork in the Arapaho National Forest: 12,280 acres; 16% contained (slight increase in size; increased containment)
Not much to see in the 24 hour precipitation totals on our State Precipitation Map below as no significant rain occurred yesterday.
Click Here For Map Overview
