Issue Date: Monday, September 21st, 2020
Issue Time: 10AM MDT
Summary:
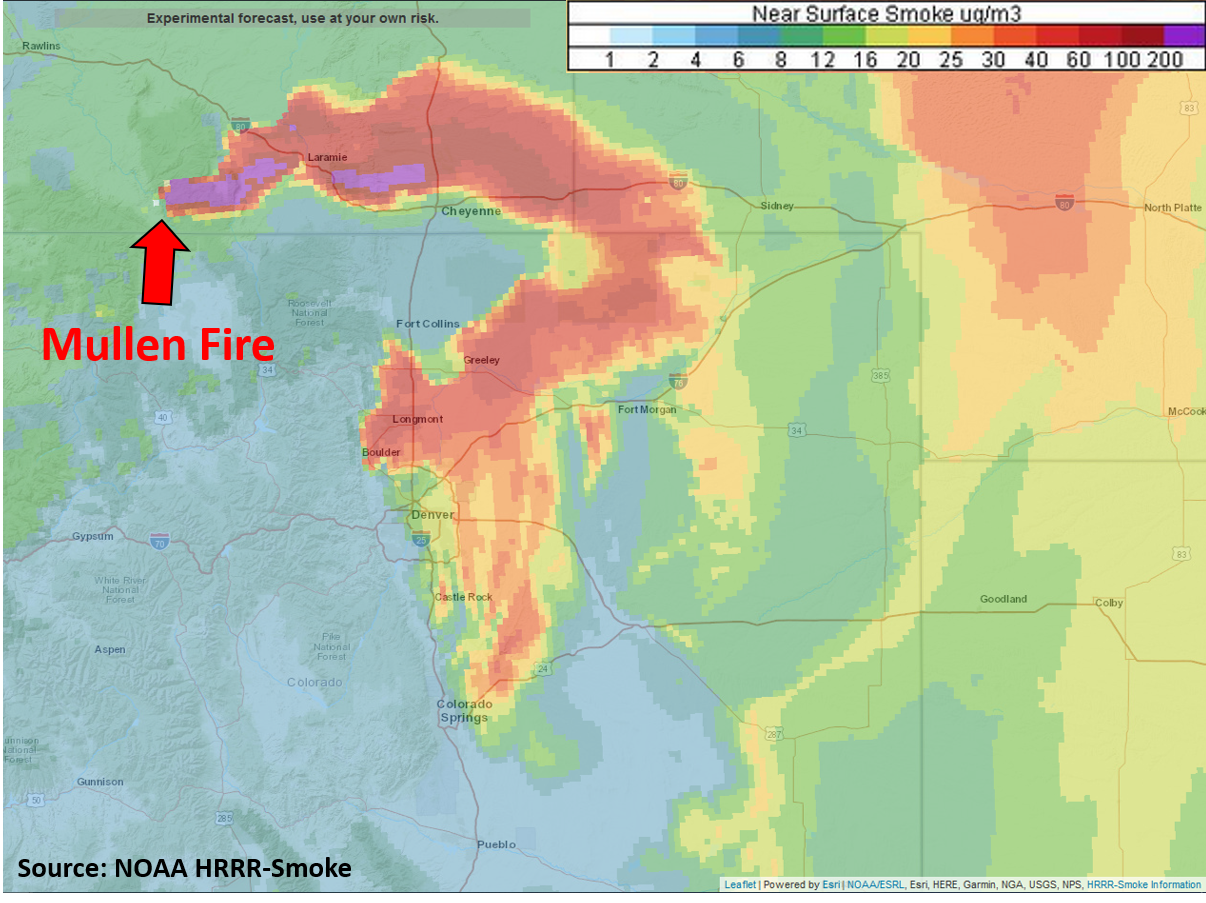
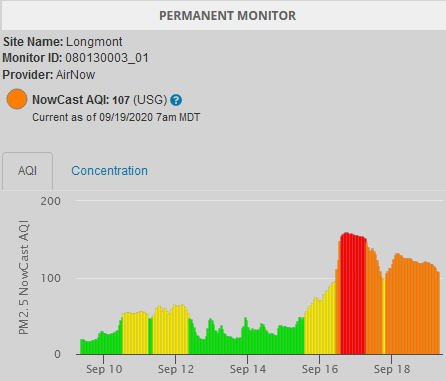
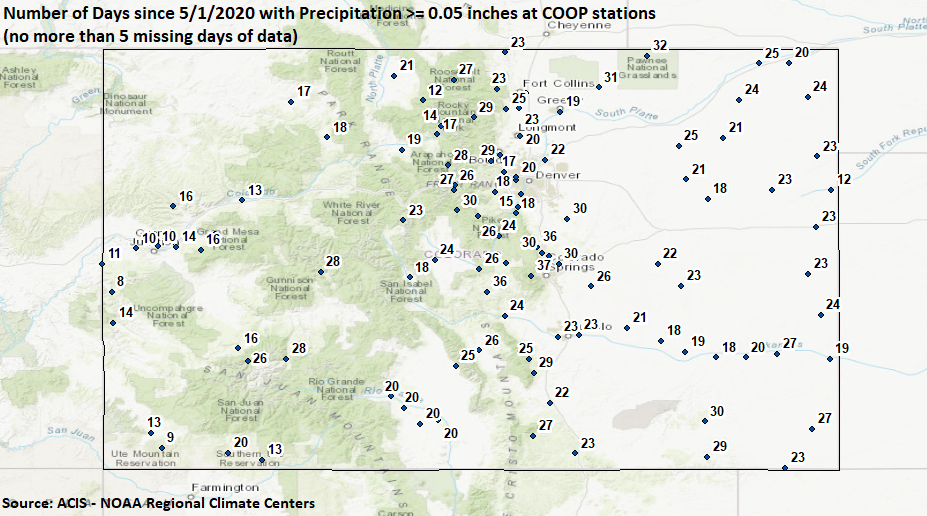
It was another beautiful September day across the state, minus the haze, with afternoon cloud cover over the mountains. There was a nice cloud deck over the southern Front Range/Urban Corridor in the morning associated with a weak boundary. This kept temperatures a bit cooler than they normally would have been. With the speed max overhead, there were windy conditions over the Front Range and Northern Mountains during the afternoon. Gusts reached between 30 and just under 40 mph, which helped expand the ongoing fires in the area. As far as rain, scattered light showers developed over the Front Range during the early evening hours and spilled into the adjacent plains. Most storms began to evaporate as they moved into the lower elevations, but some light showers were observed in Weld County on the southern side of the Cheyenne Ridge. Not many observations in the area, and QPE was under 0.25 inches (between 0.10 and just under 0.20 inches). Light showers also formed this morning along a convergence boundary produced by the lee trough. As anticipated, flooding was not forecast.
Large ongoing Colorado wildfires update (as of 9:55AM from InciWeb):
Cameron Peak in the Medicine Bow Mountains: 104,157 acres; 15% contained
Middle Fork Fire in Routt County: 6,187 acres; 0% containment
Williams Fork in the Arapaho National Forest: 12,320 acres; 16% contained
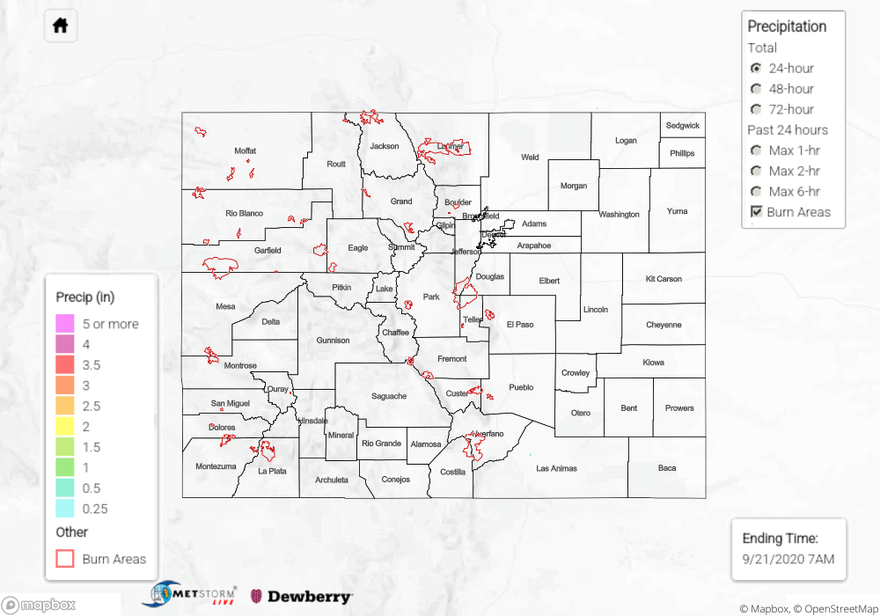
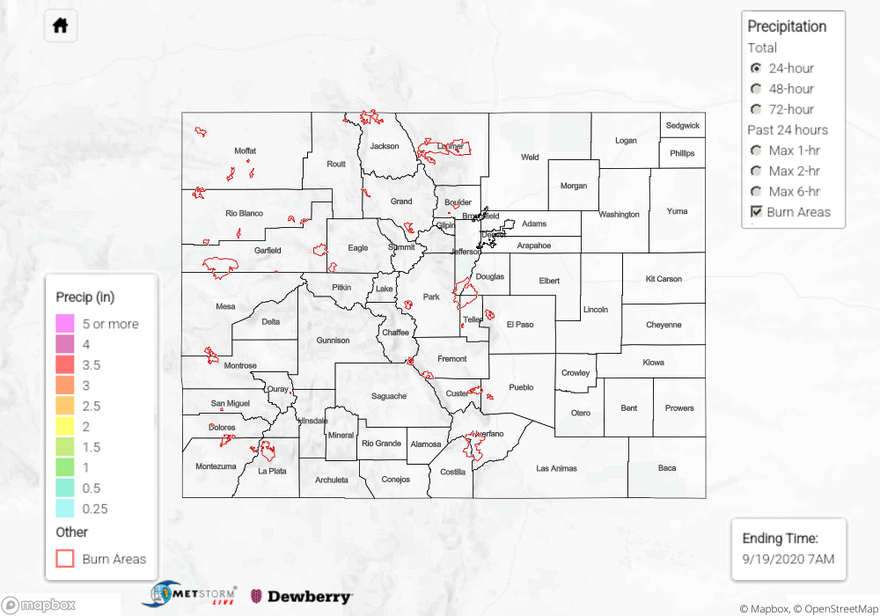
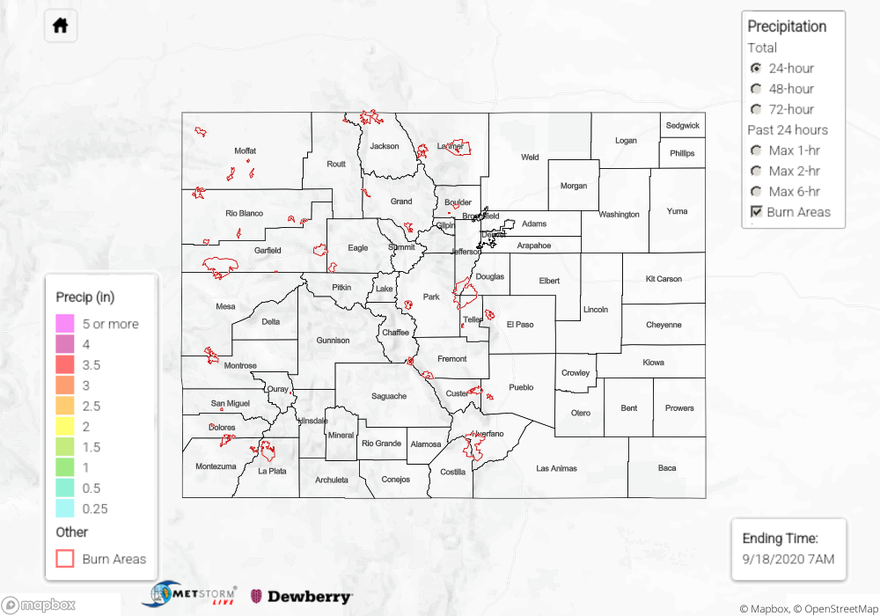
To see precipitation estimates over your area the last 24-hours, scroll down to the State Precipitation Map below. Due to only light rainfall the last couple of days, the map continues to look blank.
Click Here For Map Overview