Issue Date: Saturday, September 19th, 2020
Issue Time: 10:15AM MDT
Summary:
Once again no precipitation fell across Colorado yesterday. However, we finally got some upper-level clouds to move in over the northwestern part of the state yesterday afternoon ahead of a strong trough moving into the Pacific Northwest. Although these high clouds did not bring any surface moisture or precipitation, they are a sign of more interesting weather this weekend.
Temperatures were 5-10F above normal yesterday, with highs in the mid 80Fs for Grand Junction and Denver. Some locations in the Southeast Plains even reached the 90F mark, with Lamar recording the highest temperature of 91F. Although this warmth is above normal, it has stayed below record values. However, it is not helping our current drought and fire situation.
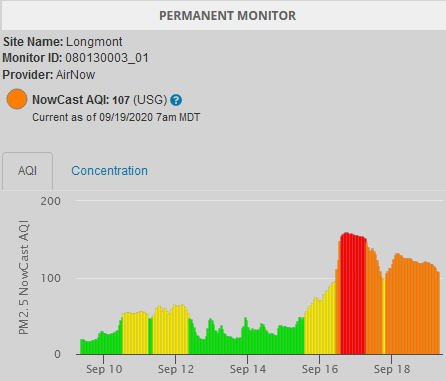
Air quality remains to be an issue due to the wildfire smoke over the state. The image below shows the air quality index (AQI) for a permanent monitoring site in Longmont (northern Urban Corridor). You can see that air quality has been in the moderate (yellow) to unhealthy (red) range since Tuesday afternoon (15 September). Much of eastern Colorado is again under an Air Quality Alert today, so you may want to limit your outdoor exercises if you are sensitive to the smoke. Pay attention to your local NWS office for more information. Luckily, the passing trough and southwesterly winds today should start pushing some of this smoke out of the state, but it will likely be some time before we see crystal clear skies.
Ongoing Colorado wildfires update (as of 10:10AM from InciWeb):
Middle Fork in the Park Range: 5,837 acres; 0% contained
Cameron Peak in the Medicine Bow Mountains: 102,596 acres; 15% contained
Williams Fork in the Arapaho National Forest: 12,280 acres; 16% contained
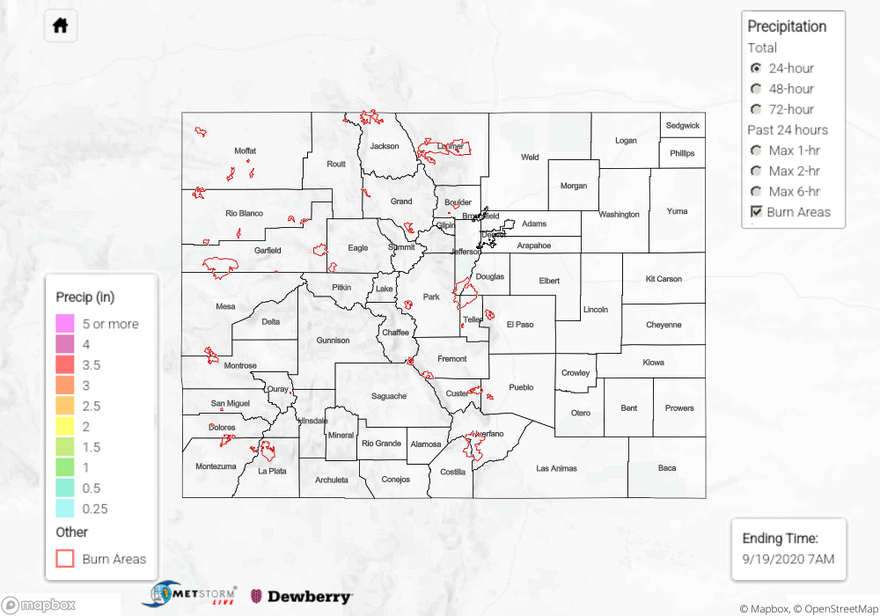
Check out our State Precipitation Map below to see 24, 48, and 72 hour precipitation totals, although you will have trouble finding any accumulations due to the dry conditions.
Click Here For Map Overview