Issue Date: Friday, September 18th, 2020
Issue Time: 9:30AM MDT
Summary:
Groundhog Day, broken record, same old story – pick any of these idioms to describe the last few days of weather. Thursday was another day with above average temperatures, dry weather, and smoky conditions under the ridging pattern. With increasing winds and little to no precipitation anticipated for the event over the weekend, there is a chance that ongoing fires may expand. Even though the statewide open fire ban is coming to an end, doesn’t mean there won’t be fire restrictions. You can follow the latest on fire bans and danger for Colorado here: http://www.coemergency.com/p/fire-bans-danger.html
Large ongoing Colorado wildfires update (as of 9:30AM from InciWeb):
Cameron Peak in the Medicine Bow Mountains: 102,596 acres; 15% contained
Middle Fork Fire in Routt County: 5,445 acres; 0% containment
Williams Fork in the Arapaho National Forest: 12,280 acres; 16% contained
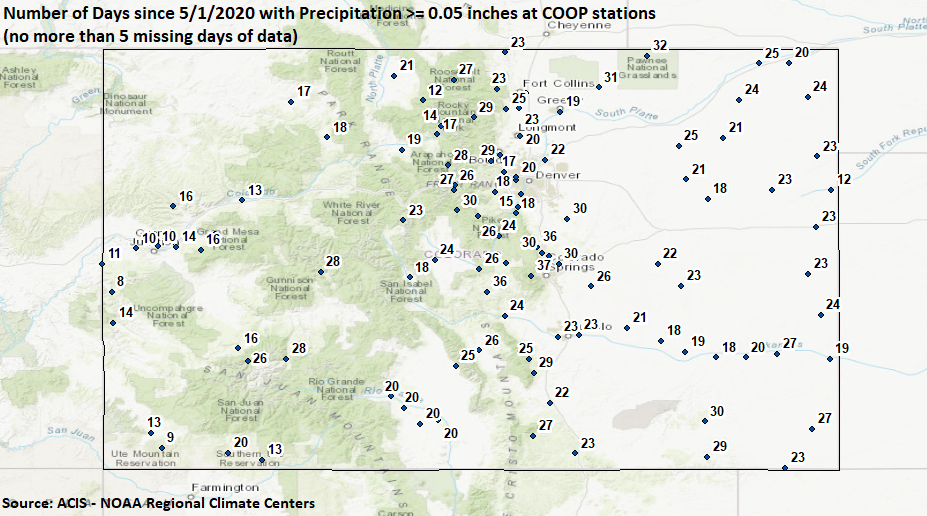
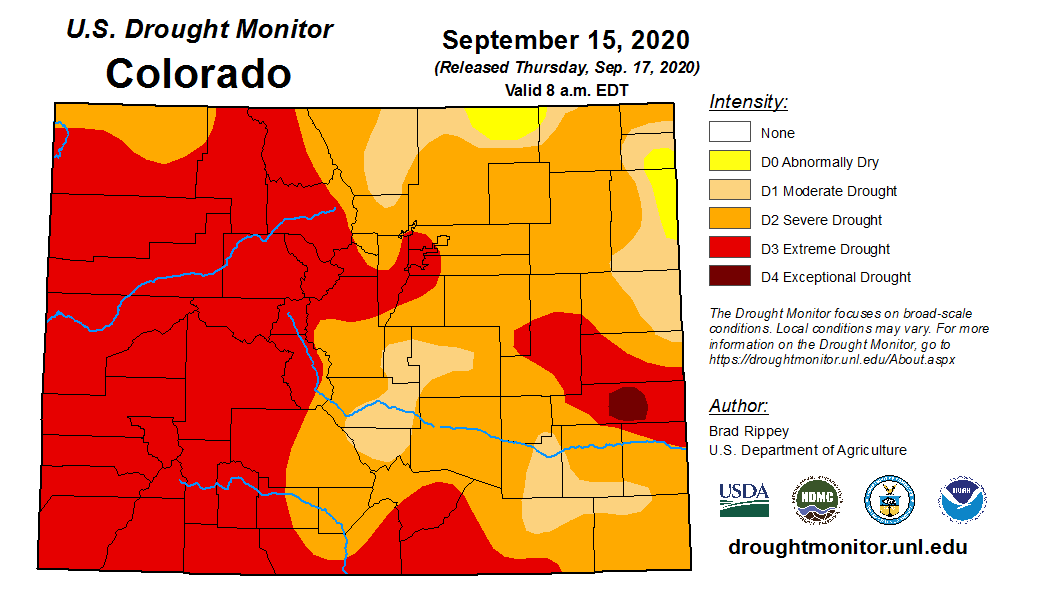
With the continuing 2020 drought (bottom image), I wanted to take a look at precipitation across the state since May (top image). Below is a map that shows the number of days with measurable precipitation for various sites across Colorado since May 1 (source: ACIS). Measurable precipitation is defined as greater than or equal to 0.05 inches, and stations had to have no more than 5 missing days of data to be included in the map. One area that sticks out is the always active Palmer Ridge (Colorado Springs area), which had just over 30 days of measurable precipitation. For reference, on average they have 34 days of measurable rainfall (May to September), so this is not too far off from normal. Another area that sticks out on the map are the low numbers of precipitation days over the Grand Valley. However, this is only about 8 days below normal for the analyzed time frame. After looking through climatology of precipitation days (listed below), there is generally a decrease in the number of precipitation days this year, but they aren’t too far off from normal. The worsening drought indicates that perhaps it is more the amount of rainfall, rather than the rainfall days contributing to the dry conditions.
Station/Days of Precip Climo (May – Sept)
| Colorado Springs | 34 |
| Denver | 27 |
| Fort Collins | 28 |
| Pueblo | 23 |
| Grand Junction | 18 |
| Trinidad | 30 |
| Lamar | 24 |
| Burlington | 29 |
| Hayden | 29 |
| Ouray | 29 |
| Alamosa | 20 |
| Cortez | 19 |
| Buena Vista | 25 |
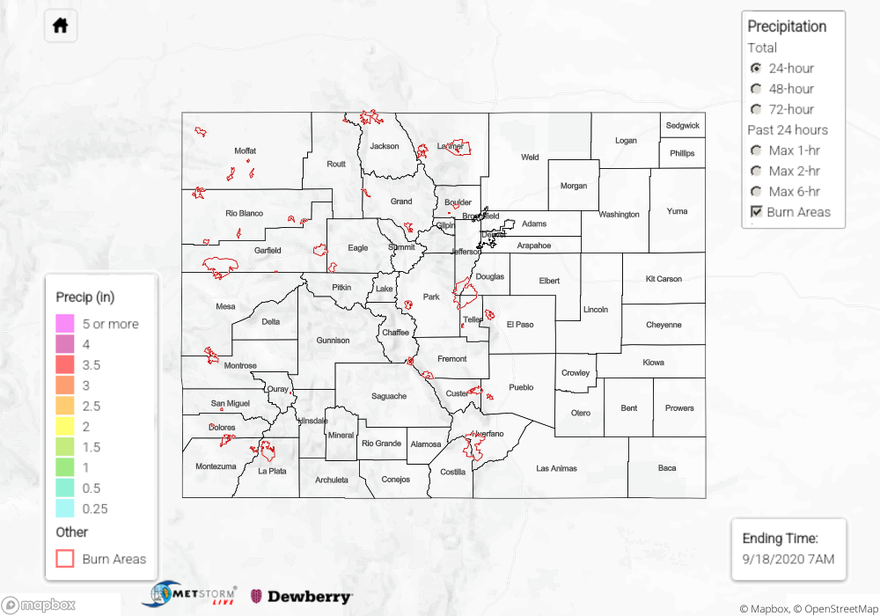
To see precipitation estimates over your area the last 24-hours, scroll down to the State Precipitation Map below. Due to the continued dry conditions, the map looks blank.
Click Here For Map Overview