Issue Date: Sunday, September 20th, 2020
Issue Time: 10:00AM MDT
Summary:
Showers moved through northwestern Colorado yesterday and last night with an advancing trough, but precipitation stayed weak. This morning, rain gauges are reporting up to 0.08 inches of rainfall over the Northwest Slope, Northern Mountains, and Central Mountains regions. We will take what we can get, but this is not much of a beneficial rainfall.
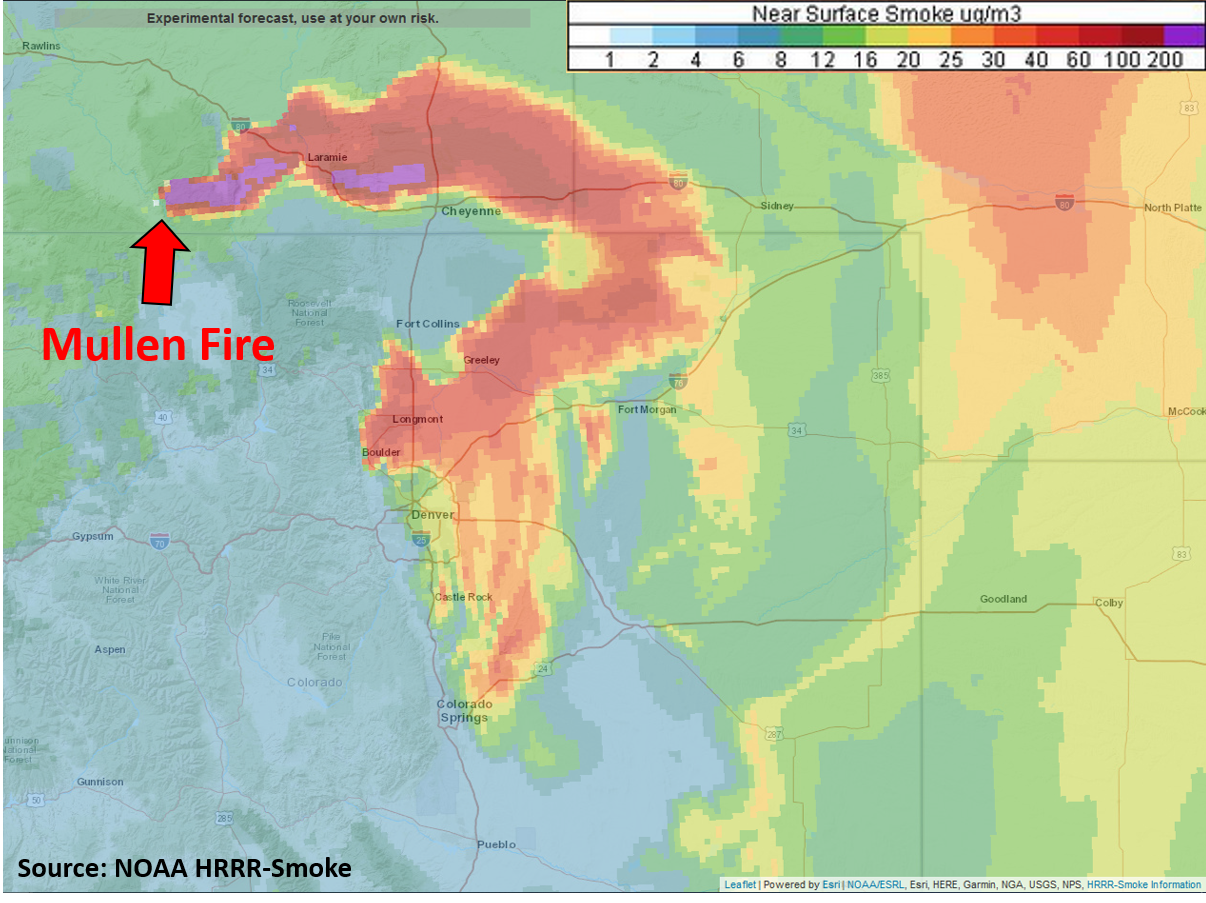
Along with showers, winds gusted up to 56 mph, which did not help the fire situation. Fortunately, the increased humidity kept fire activity low for the current Colorado wildfires (see update below). The Mullen Fire in southern Wyoming was not so lucky as a significant smoke plume could be seen streaming northeast of its location in the Medicine Bow Mountains, indicating rapid fire growth. In fact, fire fighting resources were pulled back due to the strong and erratic winds for the Mullen Fire. Although the advancing trough was able to push the thickest smoke east out of the state, smoke from the Mullen Fire is still impacting air quality for select locations in the northern Urban Corridor (see image below). Air quality monitors in Greeley and Longmont are both showing Unhealthy levels, whereas Boulder air quality is actually in the Good levels. We just can’t seem to escape wildfire smoke this year.
Ongoing Colorado wildfires update (as of 9:55AM from InciWeb):
Middle Fork in the Park Range: 5,837 acres; 0% contained
Cameron Peak in the Medicine Bow Mountains: 102,596 acres; 15% contained
Williams Fork in the Arapaho National Forest: 12,320 acres; 16% contained
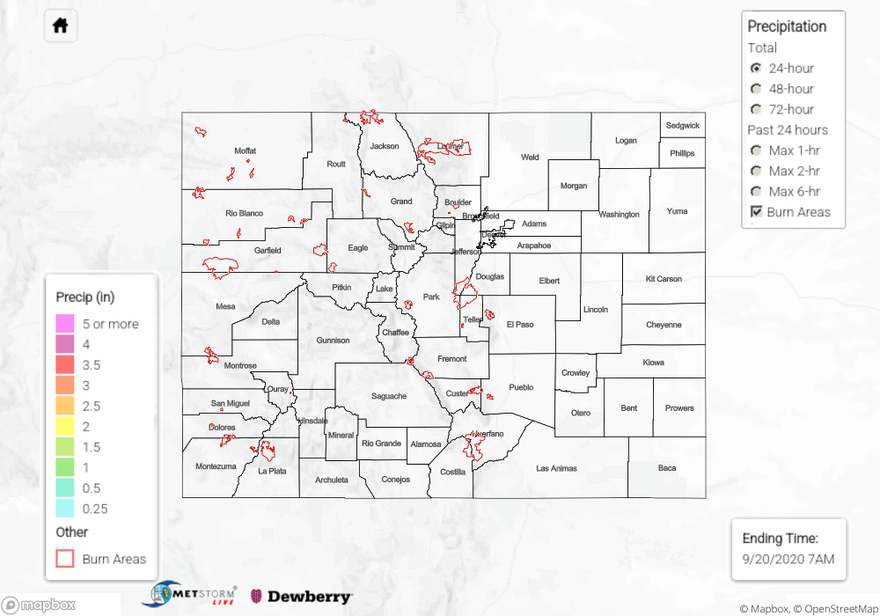
For precipitation estimates in your neighborhood over the last 24, 48, and 72 hours, check out our State Precipitation Map below.
Click Here For Map Overview