SPM 05-11-2021: Rainy and Snowy Day Across Colorado

Issue Date: Tuesday, May 11, 2021
Issue Time: 10:00 am MDT

Summary

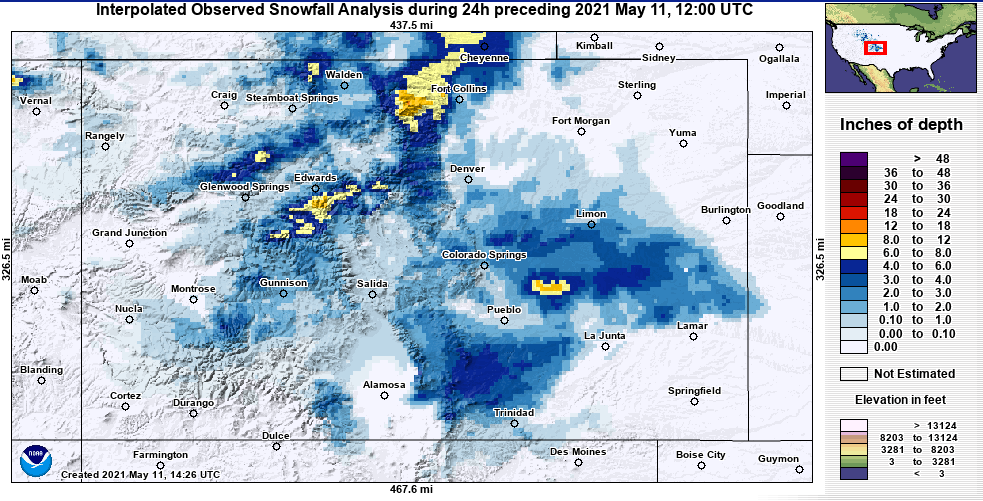
Heavy mountain snow and a chance for some snow/wintry precipitation at lower elevations was in the forecast, and that’s exactly what we got with this spring storm! Over a foot of new snow was recorded in the Northern Mountains, including 13.0” on Trail Ridge Road in Larimer Country. The below map from NOHRSC shows interpolated snowfall observations ending at 6:00 am this morning across the state. In addition to the Northern Mountains, centers of 8-12 inches of snow were also observed in the Central Mountains and along the Palmer Ridge. At lower elevations along the Front Range and Eastern Plains, there was widespread light snowfall, with some pockets up to 6 inches as well. Additional snowfall reports from the NWS are found in the table below as well.

When it wasn’t falling as snow, there was still plenty of rain accompanying this system. CoCoRaHS observers in Fort Collins recorded over an inch and half of liquid precipitation in just 24-hours, and there were similar liquid precipitation totals on the Southeastern Plains. Due to the long-duration and low-intensity nature of yesterday’s precipitation, flooding was not reported on Monday. For precipitation estimates in your area, check out our State Precipitation Map below.


5-11-2021 Snowfall

wdt_ID Observation Time Location Snow Depth (in.)
1 03:00 am MDT - 5/11/2021 1 E TRAIL RIDGE, CO 13
2 08:00 pm MDT - 5/10/2021 3 NNE MT AUDUBON, CO 10
3 08:00 pm MDT - 5/10/2021 BEAR LAKE, CO 10
4 09:00 pm MDT - 5/10/2021 4 WSW TRAIL RIDGE, CO 10
5 08:00 am MDT - 5/11/2021 1 ESE WARREN AF BASE, WY 8.9
6 09:30 pm MDT - 5/10/2021 ESTES PARK, CO 8.8
7 03:00 am MDT - 5/11/2021 4 S LONG'S PEAK, CO 8
8 09:00 pm MDT - 5/10/2021 1 NNW CAMERON PASS, CO 8
9 07:00 am MDT - 5/11/2021 7 NNE LA VETA, CO 8
10 08:30 am MDT - 5/11/2021 2 NNE CHEYENNE, WY 7.5
Observation Time Location Snow Depth (in.)

Click Here For Map Overview

The map below shows radar-estimated, rainfall gage-adjusted Quantitative Precipitation Estimates (QPE) across Colorado. The map is updated daily during the operational season (May 1 – Sep 30) by 11AM. The following six layers are currently available: 24-hour, 48-hour and 72-hour total precipitation, as well as maximum 1-hour, 2-hour and 6-hour precipitation over the past 24 hour period (to estimate where flash flooding may have occurred). The accumulation ending time is 7AM of the date shown in the bottom right corner. Also shown optionally are vulnerable fire burn areas (post 2012), which are updated throughout the season to include new, vulnerable burn areas. The home button in the top left corner resets the map to the original zoom.
SPM 05-10-2021: Calm Before the Storm

Issue Date: Monday, May 10, 2021
Issue Time: 9:15 am MDT

Summary

Much of the eastern half of the state received some measurable precipitation yesterday, thanks to the widespread, stratiform rainfall. Some areas lucked out more than others, especially along the Northern Front Range and Urban Corridor, where a consistent 0.2” – 0.4” fell in Larimer and Boulder counties according to CoCoRaHS observers and SNOTEL sites. The western half of the state remained dryer,but still picked up some moisture, which helps with the ongoing fire danger and all red flag warnings for the region have since expired. Due to the low intensity nature of yesterday’s precipitation, flooding was not reported on Sunday. For rainfall estimates in your area, check out our State Precipitation Map below.

Colorado is no stranger to wild swings of weather, especially in the springtime, and yesterday marked the start of a much wetter few days for the state. Heavy snow is forecasted for the central mountains, but there’s potential for even lower elevations to get some snow or wintry precipitation along with it. The SPM will be updated daily to reflect total moisture received with this system and exciting snowfall totals.

Click Here For Map Overview

The map below shows radar-estimated, rainfall gage-adjusted Quantitative Precipitation Estimates (QPE) across Colorado. The map is updated daily during the operational season (May 1 – Sep 30) by 11AM. The following six layers are currently available: 24-hour, 48-hour and 72-hour total precipitation, as well as maximum 1-hour, 2-hour and 6-hour precipitation over the past 24 hour period (to estimate where flash flooding may have occurred). The accumulation ending time is 7AM of the date shown in the bottom right corner. Also shown optionally are vulnerable fire burn areas (post 2012), which are updated throughout the season to include new, vulnerable burn areas. The home button in the top left corner resets the map to the original zoom.

SPM 05-09-2021: Gusty Thunderstorms

Issue Date: Sunday, May 9, 2021
Issue Time: 10:30 am MDT

Summary

The state finally saw some more measurable and widespread precipitation yesterday, especially along the Urban Corridor and Northeast Plains. This was a result of some widespread thunderstorms associated with the low-pressure trough and cold front that pushed across the state yesterday. These storms did have severe potential, and five Severe Thunderstorm Warnings were issued for storms on the Eastern Plains. Flooding was not reported on Saturday, for rainfall estimates in your area, check out our State Precipitation Map below.

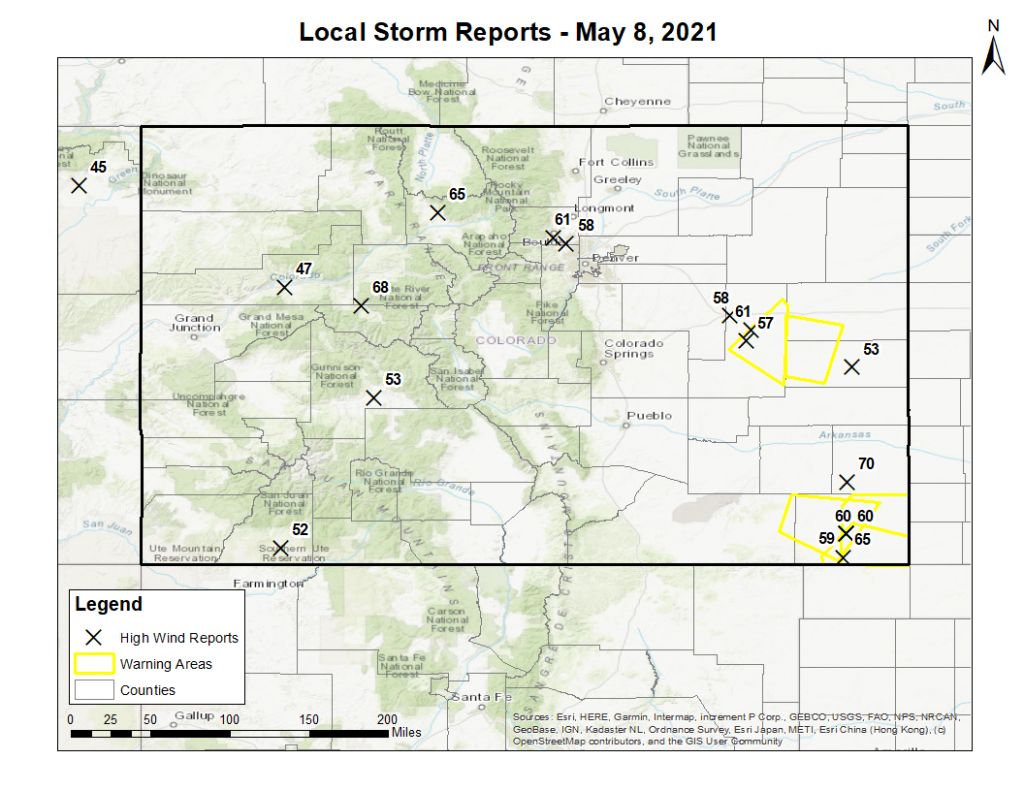
Along with the severe potential, yesterday was also another day with a number of high wind reports, this time from both non-thunderstorm and thunderstorm winds alike. Reports came in across the state, from Cortez in southwest, Boulder along the Front Range, and Springfield in the southeast. The highest wind report was 70 mph winds in Prowers County! The map below shows the locations of the high wind reports and their reported magnitude in miles per hour, as well as the Severe Thunderstorm Warning areas issued by the Goodland, KS, Boulder and Pueblo WFOs.

Click Here For Map Overview

The map below shows radar-estimated, rainfall gage-adjusted Quantitative Precipitation Estimates (QPE) across Colorado. The map is updated daily during the operational season (May 1 – Sep 30) by 11AM. The following six layers are currently available: 24-hour, 48-hour and 72-hour total precipitation, as well as maximum 1-hour, 2-hour and 6-hour precipitation over the past 24 hour period (to estimate where flash flooding may have occurred). The accumulation ending time is 7AM of the date shown in the bottom right corner. Also shown optionally are vulnerable fire burn areas (post 2012), which are updated throughout the season to include new, vulnerable burn areas. The home button in the top left corner resets the map to the original zoom.
SPM 05-08-2021: Dry and Windy Day for West

Issue Date: Saturday, May 8, 2021
Issue Time: 9:15 am MDT

Summary

Yesterday was another uneventful day in terms of precipitation across the state. A handful of CoCoRaHS stations picked up Trace – 0.2” of precipitation, and some high-elevation SNOTEL stations in the Northern, Central, and San Juan Mountains picked up an additional 0.1” of liquid precipitation. Flooding was not reported on Friday, for rainfall estimates in your area, check out our State Precipitation Map below.

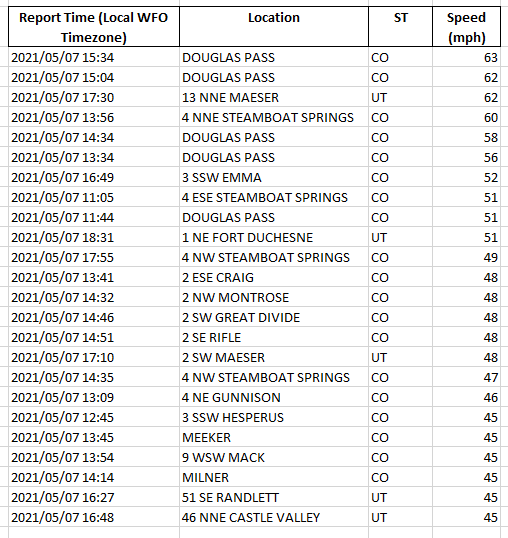
The real story of the day was non-thunderstorm high winds reported all along the Western Slope yesterday afternoon ahead of the approaching cold front. The table below shows the reports yesterday to the Grand Junction WFO, with wind gusts as high as 63 mph at Douglas Pass in Garfield County. This also marks the breakdown in the warm and dry pattern across the state for the past few days, ushering in cooler temperatures and a chance for much needed accumulating precipitation.

Click Here For Map Overview

The map below shows radar-estimated, rainfall gage-adjusted Quantitative Precipitation Estimates (QPE) across Colorado. The map is updated daily during the operational season (May 1 – Sep 30) by 11AM. The following six layers are currently available: 24-hour, 48-hour and 72-hour total precipitation, as well as maximum 1-hour, 2-hour and 6-hour precipitation over the past 24 hour period (to estimate where flash flooding may have occurred). The accumulation ending time is 7AM of the date shown in the bottom right corner. Also shown optionally are vulnerable fire burn areas (post 2012), which are updated throughout the season to include new, vulnerable burn areas. The home button in the top left corner resets the map to the original zoom.