SPM 05-27-2021: Drought Conditions Continue to Improve in Eastern Colorado

Issue Date: Thursday, May 27, 2021
Issue Time: 9:00 am MDT

Summary

Afternoon thunderstorms produced heavy rain and even quarter-size hail in the Northeastern Plains yesterday, mostly along the I-76 corridor. Sterling picked up over 0.40 inches of rain and Julesburg got 0.34 inches before the line of thunderstorms crossed into Nebraska. This continues the typical late-spring pattern of active severe weather days on the eastern plains. High pressure on the Colorado-Utah border kept the weather dry for the Western Slope.

Flooding was not reported on Wednesday. For rainfall estimates in your area, check out our State Precipitation Map below.

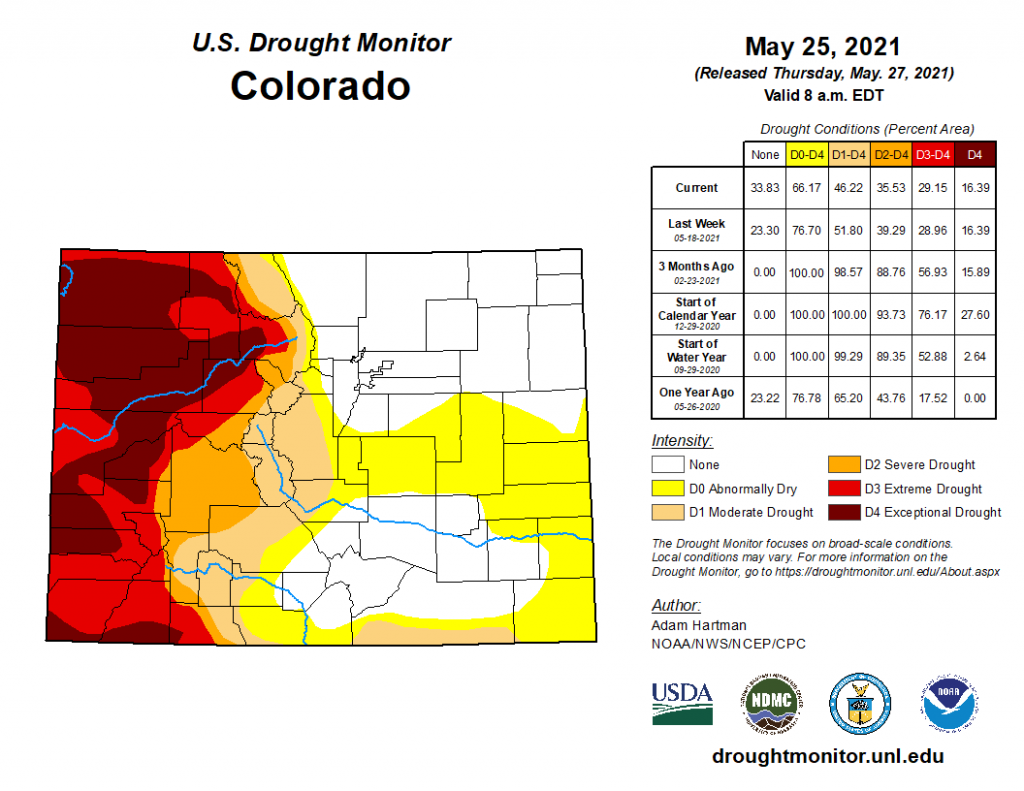
Drought conditions continue to improve in parts of Colorado, as seen in the map below released this morning and reflective of conditions through Tuesday of this week. This is especially true in the eastern half of the state where the total area experiencing no drought increased to nearly 34%, up from 23% last week! Northeastern Colorado continues to benefit from an abnormally wet spring, and the recent heavy rain and snow in Southeastern Colorado has greatly improved conditions there as well. Unfortunately, the good news is not shared in the western half of the state, where extreme to exceptional drought is still prevalent in most of the region.
Click Here For Map Overview

The map below shows radar-estimated, rainfall gage-adjusted Quantitative Precipitation Estimates (QPE) across Colorado. The map is updated daily during the operational season (May 1 – Sep 30) by 11AM. The following six layers are currently available: 24-hour, 48-hour and 72-hour total precipitation, as well as maximum 1-hour, 2-hour and 6-hour precipitation over the past 24 hour period (to estimate where flash flooding may have occurred). The accumulation ending time is 7AM of the date shown in the bottom right corner. Also shown optionally are vulnerable fire burn areas (post 2012), which are updated throughout the season to include new, vulnerable burn areas. The home button in the top left corner resets the map to the original zoom.

Note: The 24-hour, 48-hour and 72-hour total precipitation do not contain bias corrections today due to errors in the CoCoRaHS data. This means there may be underestimations in QPE over the southwest and southeast corners of the state.

SPM 05-26-2021: Minor Flooding along Purgatoire River near Las Animas, CO

Issue Date: Wednesday, May 26, 2021
Issue Time: 9:15 am MDT

Summary

High pressure in Western Colorado yesterday dominated the weather pattern across the state, creating warm and dry conditions. There ware a handful of 0.0 – 0.1 inch precipitation observations along the Front Range and Eastern Plains from CoCoRaHS observers, but nothing widespread or significant. For rainfall estimates in your area, check out our State Precipitation Map at the bottom of today’s post.

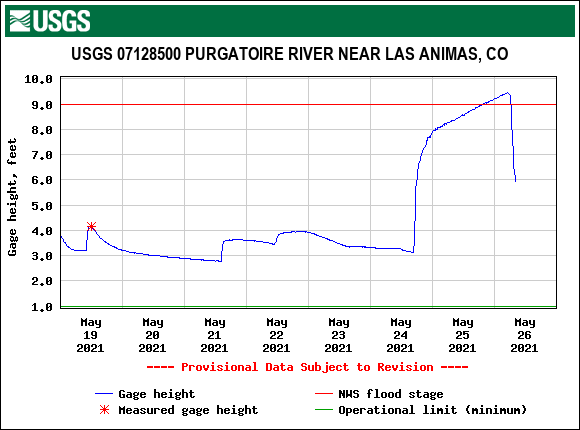
A lack of rain does not mean there was no reported flooding yesterday though. A flood warning was issued for the Purgatoire River near Las Animas in Bent County on Monday evening, and the warning was updated regularly yesterday to reflect the continued threat. The hydrograph below shows gauge height in feet at the Purgatoire River near Las Animas, where late yesterday and early this morning the height exceeded the NWS flood stage and indicated minor flooding was occurring. As of 7:25 am this morning, the warning is still in effect.

In Northern Colorado, several gauges along the Cache la Poudre river are also experiencing higher than normal streamflow

Click Here For Map Overview

The map below shows radar-estimated, rainfall gage-adjusted Quantitative Precipitation Estimates (QPE) across Colorado. The map is updated daily during the operational season (May 1 – Sep 30) by 11AM. The following six layers are currently available: 24-hour, 48-hour and 72-hour total precipitation, as well as maximum 1-hour, 2-hour and 6-hour precipitation over the past 24 hour period (to estimate where flash flooding may have occurred). The accumulation ending time is 7AM of the date shown in the bottom right corner. Also shown optionally are vulnerable fire burn areas (post 2012), which are updated throughout the season to include new, vulnerable burn areas. The home button in the top left corner resets the map to the original zoom.

Note: The 24-hour, 48-hour and 72-hour total precipitation do not contain bias corrections today due to errors in the CoCoRaHS data. This means there may be underestimations in QPE over the southwest and southeast corners of the state.

SPM 05-25-2021: Isolated Thunderstorms Near Kansas Border

Issue Date: Tuesday, May 25, 2021
Issue Time: 10:15 am MDT

Summary

Isolated thunderstorms on the Eastern Plains brought significant precipitation to the towns of Burlington and Holly yesterday evening and overnight, though most of the really heavy rainfall occurred on the Kansas side of the state border. 1.20 inches was recorded by CoCoRaHS observers in Burlington, and according to their notes most of that precipitation fell in just 25 minutes overnight, along with pea-sized hail. Flood warnings were issued by the Pueblo and Goodland, KS WFOs for both cells after Doppler radar indicated heavy rainfall, and minor flooding was reported in Burlington. The day was calm and dry for the rest of Colorado. For rainfall estimates in your area, check out our State Precipitation Map below.

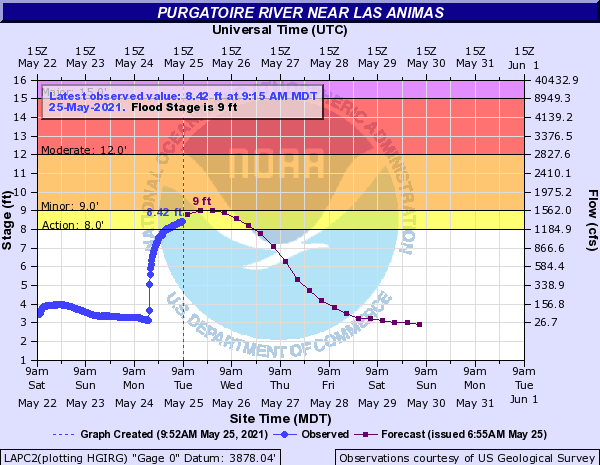
The Purgatoire River near Las Animas is currently in an “Action” stage, or near flood levels, as seen in the hydrograph below. Many gauges along the Arkansas River and its tributaries (including the Purgatoire) are at or above normal streamflow for this time of year. Gauges across the state will be recording their peak streamflow for the year in the coming weeks, thanks to snowmelt runoff and additional spring rain.

Click Here For Map Overview

The map below shows radar-estimated, rainfall gage-adjusted Quantitative Precipitation Estimates (QPE) across Colorado. The map is updated daily during the operational season (May 1 – Sep 30) by 11AM. The following six layers are currently available: 24-hour, 48-hour and 72-hour total precipitation, as well as maximum 1-hour, 2-hour and 6-hour precipitation over the past 24 hour period (to estimate where flash flooding may have occurred). The accumulation ending time is 7AM of the date shown in the bottom right corner. Also shown optionally are vulnerable fire burn areas (post 2012), which are updated throughout the season to include new, vulnerable burn areas. The home button in the top left corner resets the map to the original zoom.

Note: The 24-hour, 48-hour and 72-hour total precipitation do not contain bias corrections today due to errors in the CoCoRaHS data. This means there may be underestimations in QPE over the southwest and southeast corners of the state.
SPM 05-24-2021: Severe Weather on Eastern Plains

Issue Date: Monday, May 24, 2021
Issue Time: 9:15 am MDT

Summary

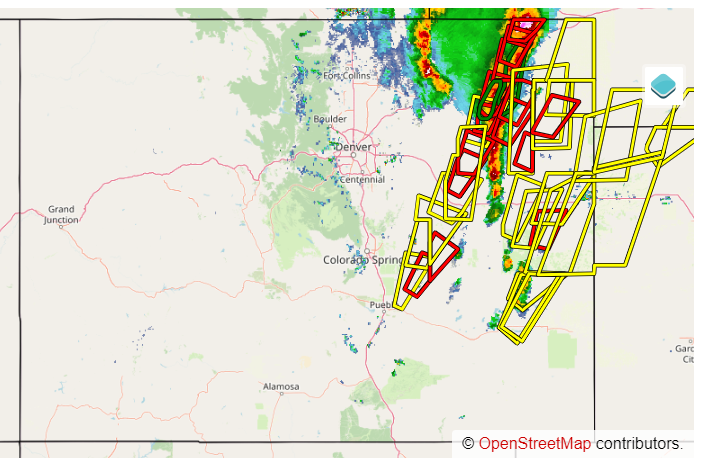
Sunday was another active severe weather day across the Eastern Plains as lines of storms fired up along a stationary front that extended north-south across the eastern half of the state. Heavy rain, large hail, high winds, and several tornadoes were reported yesterday afternoon. The progression northward of the strongest storms can be seen in the map of issued severe thunderstorm and tornado warnings, with underlying radar at 4:35 pm. A line of storms is seen on the radar, including a large tornado right near the CO-NE border.

As the system passed, flood advisories were issued due to Doppler radar indicated heavy rain and the potential for small stream flooding under areas that received a very quick 1-2 inches of precipitation. According to the MetStorm Live grids in the State Precipitation Map below, 1-hour rainfall rates were up to 1.5 inches/hour for some of these locations.

Despite the active day, flooding was not reported on Sunday. For rainfall estimates in your area, check out our State Precipitation Map below.

Click Here For Map Overview

The map below shows radar-estimated, rainfall gage-adjusted Quantitative Precipitation Estimates (QPE) across Colorado. The map is updated daily during the operational season (May 1 – Sep 30) by 11AM. The following six layers are currently available: 24-hour, 48-hour and 72-hour total precipitation, as well as maximum 1-hour, 2-hour and 6-hour precipitation over the past 24 hour period (to estimate where flash flooding may have occurred). The accumulation ending time is 7AM of the date shown in the bottom right corner. Also shown optionally are vulnerable fire burn areas (post 2012), which are updated throughout the season to include new, vulnerable burn areas. The home button in the top left corner resets the map to the original zoom.

Note: The 24-hour, 48-hour and 72-hour total precipitation do not contain bias corrections today due to errors in the CoCoRaHS data. This means there may be underestimations in QPE over the southwest and southeast corners of the state.