Issue Date: Thursday, May 27, 2021
Issue Time: 9:00 am MDT
Summary
Afternoon thunderstorms produced heavy rain and even quarter-size hail in the Northeastern Plains yesterday, mostly along the I-76 corridor. Sterling picked up over 0.40 inches of rain and Julesburg got 0.34 inches before the line of thunderstorms crossed into Nebraska. This continues the typical late-spring pattern of active severe weather days on the eastern plains. High pressure on the Colorado-Utah border kept the weather dry for the Western Slope.
Flooding was not reported on Wednesday. For rainfall estimates in your area, check out our State Precipitation Map below.
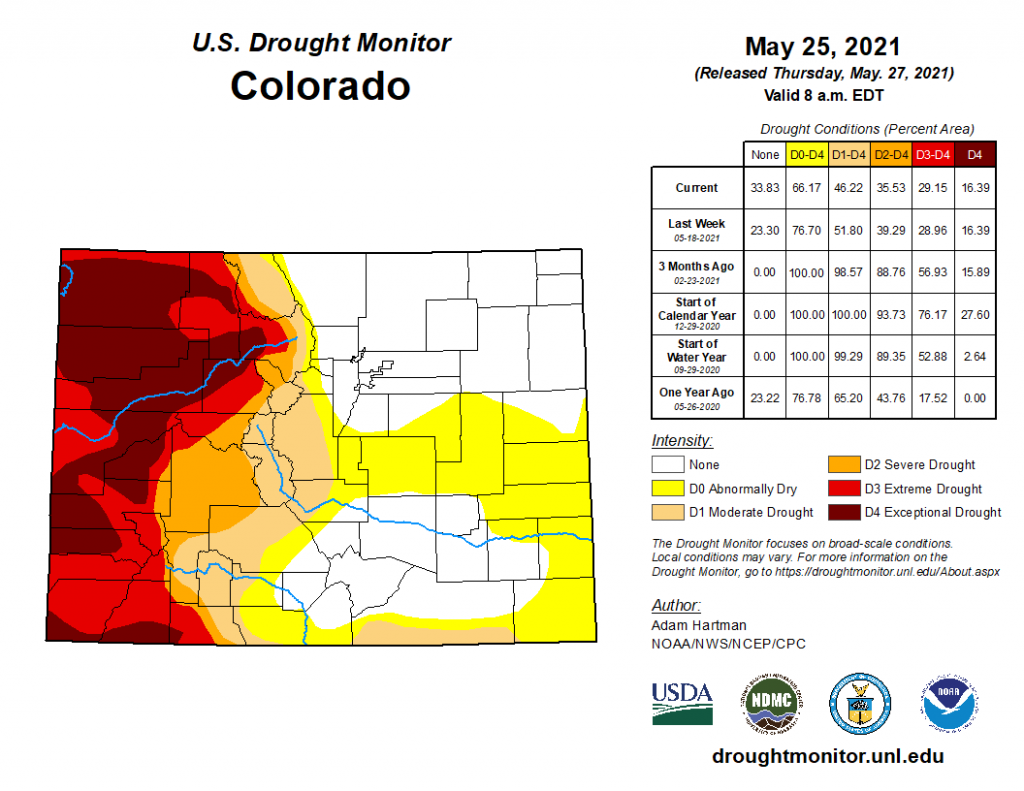
Drought conditions continue to improve in parts of Colorado, as seen in the map below released this morning and reflective of conditions through Tuesday of this week. This is especially true in the eastern half of the state where the total area experiencing no drought increased to nearly 34%, up from 23% last week! Northeastern Colorado continues to benefit from an abnormally wet spring, and the recent heavy rain and snow in Southeastern Colorado has greatly improved conditions there as well. Unfortunately, the good news is not shared in the western half of the state, where extreme to exceptional drought is still prevalent in most of the region.
Click Here For Map Overview
Note: The 24-hour, 48-hour and 72-hour total precipitation do not contain bias corrections today due to errors in the CoCoRaHS data. This means there may be underestimations in QPE over the southwest and southeast corners of the state.
