SPM 09-07-2022: More Heat, Dry Conditions; Isolated Storms for Southern San Juans

Issue Date: Wednesday, September 7th, 2022
Issue Time: 10:50 AM MDT

Summary:

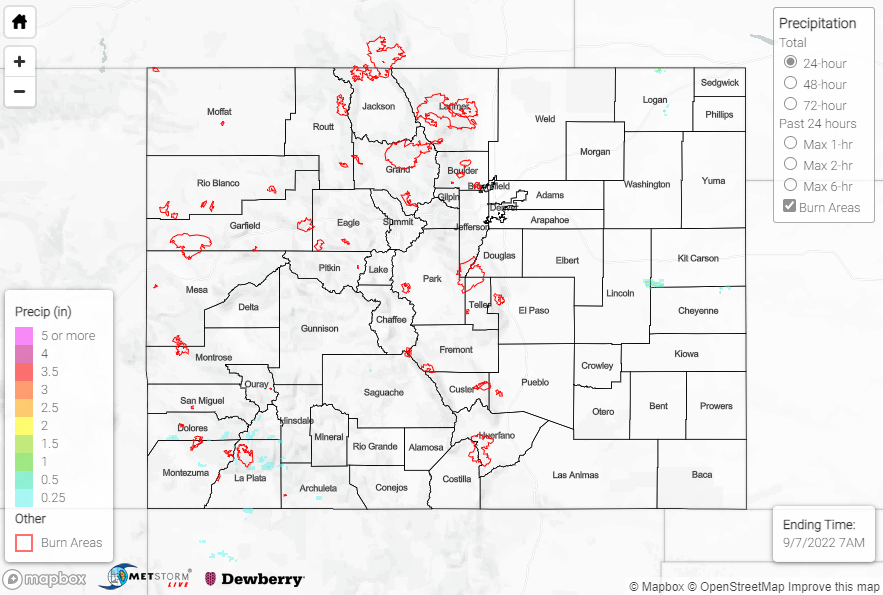
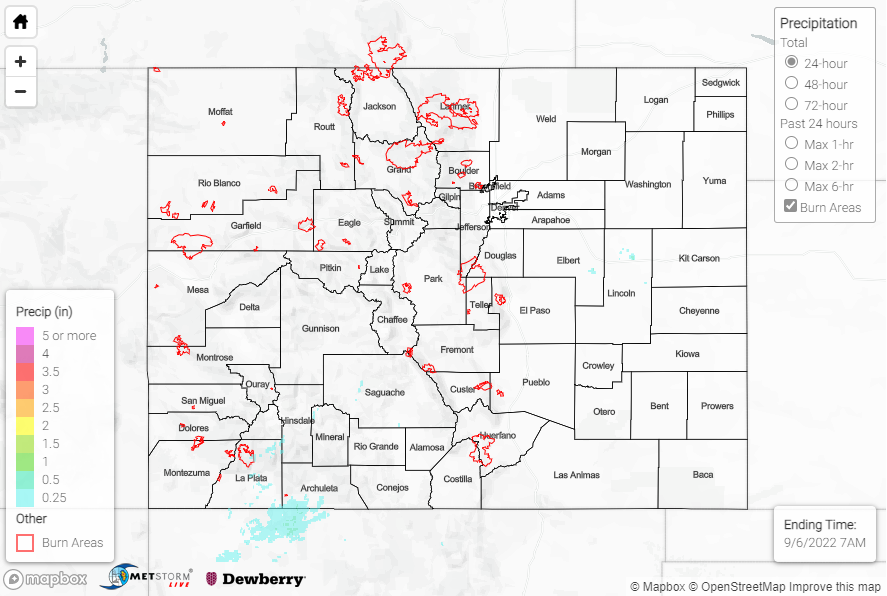
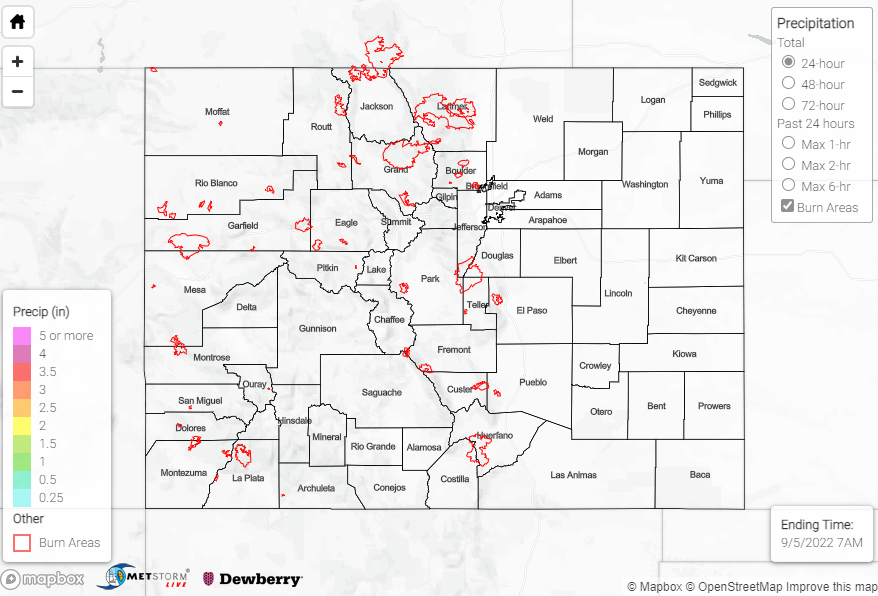
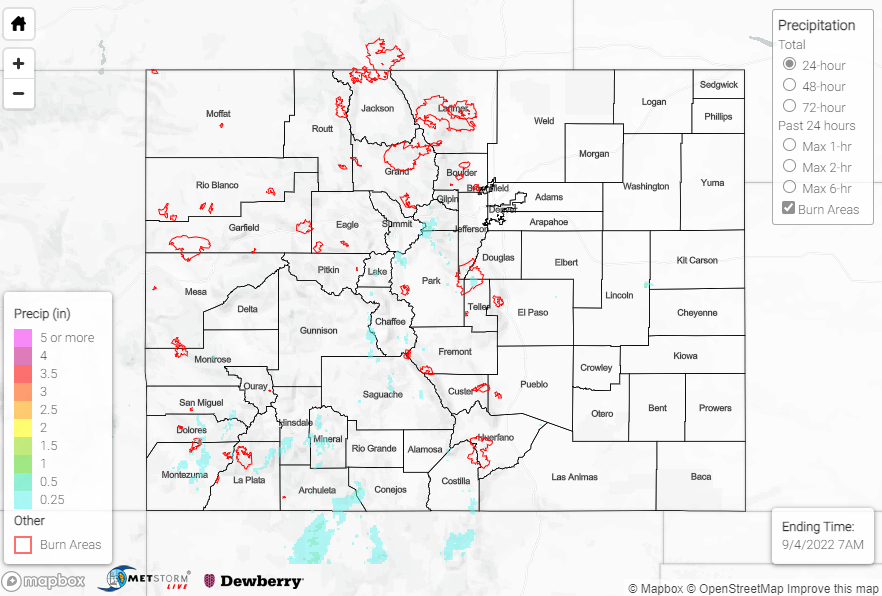
The upper-level ridge continued its dominance across our region on Tuesday, with more record-breaking warmth and dry conditions. The exception was again across the southern San Juans, where isolated storms impacted the highest elevations. QPE data suggests amounts up to 0.50” in the vicinity of Durango, where an automated station measured 0.40”. The QPE maximum in extreme southwestern Kit Carson County was not precipitation but rather the radar picking up on a wind farm.

The high temperature at Grand Junction Airport hit 101 degrees yesterday, breaking the previous record of 99. Check out some of the other records that were broken yesterday:

No flooding was reported yesterday. For precipitation estimates in our area, check out the map below. Remember, if you observe flooding in your area, you can use the “Report a Flood” page to make a flood report when you can safely do so.

Click Here For Map Overview

The map below shows radar-estimated, rainfall gage-adjusted Quantitative Precipitation Estimates (QPE) across Colorado. The map is updated daily during the operational season (May 1 – Sep 30) by 11AM. The following six layers are currently available: 24-hour, 48-hour and 72-hour total precipitation, as well as maximum 1-hour, 2-hour and 6-hour precipitation over the past 24 hour period (to estimate where flash flooding may have occurred). The accumulation ending time is 7AM of the date shown in the bottom right corner. Also shown optionally are vulnerable fire burn areas (post 2012), which are updated throughout the season to include new, vulnerable burn areas. The home button in the top left corner resets the map to the original zoom.

SPM 09-06-2022: Heat Continues to Build

Issue Date: Tuesday, September 6th, 2022
Issue Time: 10:40 AM MDT

Summary:

Unseasonable warmth continued across the state on Monday as the upper-level ridge continued to build. This ridge suppressed precipitation for the state again, with most locations experiencing plenty of sun and heat. The exception was the highest elevations of the Central Mountains and especially the San Juans, where isolated convection developed during the afternoon. Rainfall amounts were very light and had a small spatial footprint, with general amounts of 0.25” or less; the highest rain gauge observation was 0.34” near Twin Lakes Reservoir.

Several high temperature records were tied yesterday over south-central Colorado. Remember to take heat safety precautions as the warmth will continue today.

No flooding was reported yesterday. For precipitation estimates in our area, check out the map below. Remember, if you observe flooding in your area, you can use the “Report a Flood” page to make a flood report when you can safely do so.

Click Here For Map Overview

The map below shows radar-estimated, rainfall gage-adjusted Quantitative Precipitation Estimates (QPE) across Colorado. The map is updated daily during the operational season (May 1 – Sep 30) by 11AM. The following six layers are currently available: 24-hour, 48-hour and 72-hour total precipitation, as well as maximum 1-hour, 2-hour and 6-hour precipitation over the past 24 hour period (to estimate where flash flooding may have occurred). The accumulation ending time is 7AM of the date shown in the bottom right corner. Also shown optionally are vulnerable fire burn areas (post 2012), which are updated throughout the season to include new, vulnerable burn areas. The home button in the top left corner resets the map to the original zoom.

SPM 09-05-2022: Dry Statewide, Heat Builds for Labor Day Weekend

Issue Date: Monday, September 5th, 2022
Issue Time: 11:30 AM MDT

Summary:

Sunday of Labor Day Weekend featured unseasonably warm temperatures, plentiful sunshine, and precipitation-free conditions across the state. A handful of high-elevation stations reported T-0.05”, but stations recording any measurable rainfall were few and far between.

Hot conditions continue today with record-breaking heat expected. Remember to take heat safety precautions!

No flooding was reported yesterday. For precipitation estimates in our area, check out the map below. Remember, if you observe flooding in your area, you can use the “Report a Flood” page to make a flood report when you can safely do so.

Click Here For Map Overview

The map below shows radar-estimated, rainfall gage-adjusted Quantitative Precipitation Estimates (QPE) across Colorado. The map is updated daily during the operational season (May 1 – Sep 30) by 11AM. The following six layers are currently available: 24-hour, 48-hour and 72-hour total precipitation, as well as maximum 1-hour, 2-hour and 6-hour precipitation over the past 24 hour period (to estimate where flash flooding may have occurred). The accumulation ending time is 7AM of the date shown in the bottom right corner. Also shown optionally are vulnerable fire burn areas (post 2012), which are updated throughout the season to include new, vulnerable burn areas. The home button in the top left corner resets the map to the original zoom.

SPM 09-04-2022: Storms for Mountains, Rain-Free Saturday for Foothills and Plains

Issue Date: Sunday, September 4th, 2022
Issue Time: 11:35 AM MDT

Summary:

Showers and storms impacted the highest elevations of the state on Saturday, from the southern Northern Mountains southward across the San Juans and Southeast Mountains. Across the foothills and plains, dry air prevented meaningful precipitation.

The heaviest rain appears to have fallen over the southern San Juans, with QPE indicating amounts up to 1”. Rain gauge observations in this region include 0.68” at an automated station southeast of Pagosa Springs, as well as 0.44” from a CoCoRaHS observer also southeast of Pagosa Springs.

Other locations in the state that experienced rainfall generally recorded 0.25” or less, with the highest rain gauge total in the Northern/Central Mountains being 0.36” near Tabernash.

No flooding was reported yesterday. For precipitation estimates in our area, check out the map below. Remember, if you observe flooding in your area, you can use the “Report a Flood” page to make a flood report when you can safely do so.

Click Here For Map Overview

The map below shows radar-estimated, rainfall gage-adjusted Quantitative Precipitation Estimates (QPE) across Colorado. The map is updated daily during the operational season (May 1 – Sep 30) by 11AM. The following six layers are currently available: 24-hour, 48-hour and 72-hour total precipitation, as well as maximum 1-hour, 2-hour and 6-hour precipitation over the past 24 hour period (to estimate where flash flooding may have occurred). The accumulation ending time is 7AM of the date shown in the bottom right corner. Also shown optionally are vulnerable fire burn areas (post 2012), which are updated throughout the season to include new, vulnerable burn areas. The home button in the top left corner resets the map to the original zoom.