SPM 06-12-2021: Cooler, but Dry Day Across Colorado

Issue Date: Saturday, June 12, 2021
Issue Time: 8:05 AM MDT

Summary:

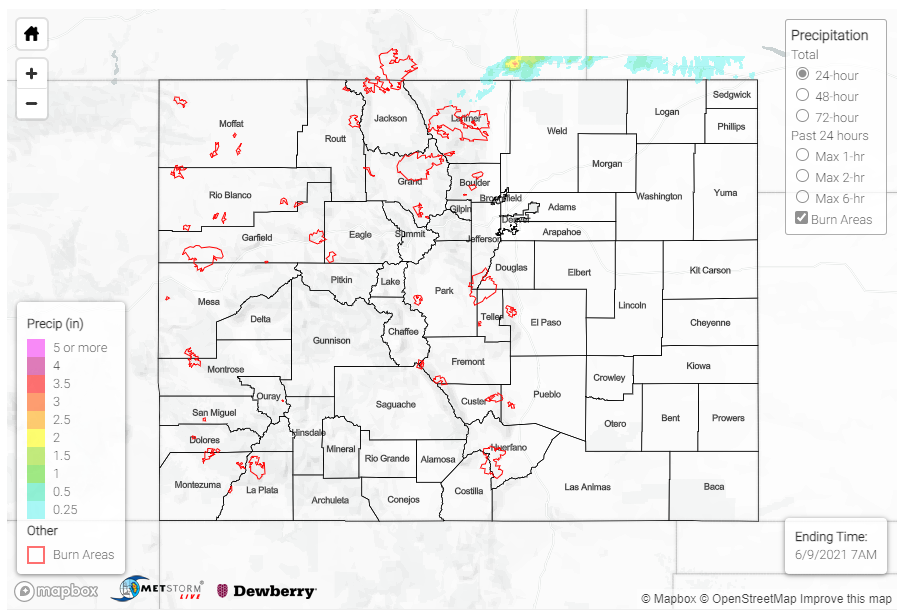
Friday, June 11 was a cooler day across state, high temperatures were nearly 10-15 degrees cooler than the previous few days. There was no precipitation across the state after the frontal-passage left much dryer air behind it. There was no flooding reported on Friday. For precipitation totals in your area, check out the State Precipitation Map at the end of today’s post.

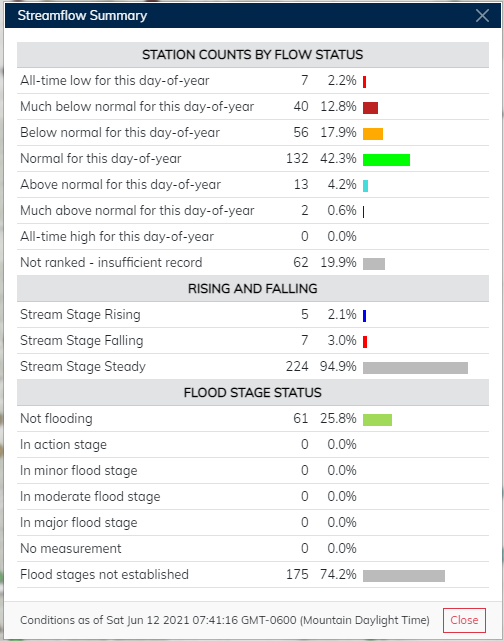
With very little precipitation in the last few days, here is a summary of streamflow from the USGS National Water Dashboard for the 312 streamflow gauges recording across the state (table below). Most of the streamflow gauges in the state are normal for this day-of-year, 132 out of 312, with a majority of them located in the North, Central, and Front Range Mountains, as well as the Urban Corridor and Southeast Plains. This makes sense considering the lack of drought conditions on the eastern half of the state. A total of 103 out of 312 gauges are in some way below normal for this day-of-year, including 7 gauges recording all time lows. Nearly all of these gauges are west of the divide, on the Western Slope or the Grand Valley, where drought conditions are extreme. By contrast, only 15 total of 312 gauges across the state are above normal. Given the lack of precipitation across the state, it also makes sense that the vast majority (nearly 95%) of gauges have a steady stream stage, rather than rising or falling. The interactive water dashboard for Colorado is found here.


Click Here For Map Overview

The map below shows radar-estimated, rainfall gage-adjusted Quantitative Precipitation Estimates (QPE) across Colorado. The map is updated daily during the operational season (May 1 – Sep 30) by 11AM. The following six layers are currently available: 24-hour, 48-hour and 72-hour total precipitation, as well as maximum 1-hour, 2-hour and 6-hour precipitation over the past 24 hour period (to estimate where flash flooding may have occurred). The 24-hour, 48-hour and 72-hour total precipitation contain bias corrections that are not disaggregated into the hourly estimates, so there will likely be some differences. The accumulation ending time is 7AM of the date shown in the bottom right corner. Also shown optionally are vulnerable fire burn areas (post 2012), which are updated throughout the season to include new, vulnerable burn areas. The home button in the top left corner resets the map to the original zoom.

SPM 06-11-2021: Frontal Passage Cools Things Off – No Precipitation

Issue Date: Friday, June 11, 2021
Issue Time: 9:20 AM MDT

Summary:

A cold-front moved across state from the northwest corner to the southeast starting in the late afternoon yesterday, continuing eastward overnight. The frontal passage brought slightly cooler temperatures and dryer air across the state. There was some early daytime convection on the eastern plains associated with a dryline trough, but little, if any, precipitation associated with these isolated storms. Flooding was not reported on Thursday. For precipitation totals in your area, including antecedent rainfall, check out the State Precipitation Map below.

Click Here For Map Overview

The map below shows radar-estimated, rainfall gage-adjusted Quantitative Precipitation Estimates (QPE) across Colorado. The map is updated daily during the operational season (May 1 – Sep 30) by 11AM. The following six layers are currently available: 24-hour, 48-hour and 72-hour total precipitation, as well as maximum 1-hour, 2-hour and 6-hour precipitation over the past 24 hour period (to estimate where flash flooding may have occurred). The 24-hour, 48-hour and 72-hour total precipitation contain bias corrections that are not disaggregated into the hourly estimates, so there will likely be some differences. The accumulation ending time is 7AM of the date shown in the bottom right corner. Also shown optionally are vulnerable fire burn areas (post 2012), which are updated throughout the season to include new, vulnerable burn areas. The home button in the top left corner resets the map to the original zoom.

SPM 06-10-2021: Persisting Hot and Dry Conditions

Issue Date: Thursday, June 10, 2021
Issue Time: 9:15AM MDT

Summary:

There was little change in the large-scale weather pattern yesterday, resulting in another hot and dry day across Colorado. The ridge strengthening in the eastern half of the state limited storm development on the eastern plains, while southwesterly flow brought very dry air to the western half of the state. Flooding was not reported on Thursday. For rainfall estimates in your area, including antecedent conditions, check out the State Precipitation Map at the bottom of today’s post.

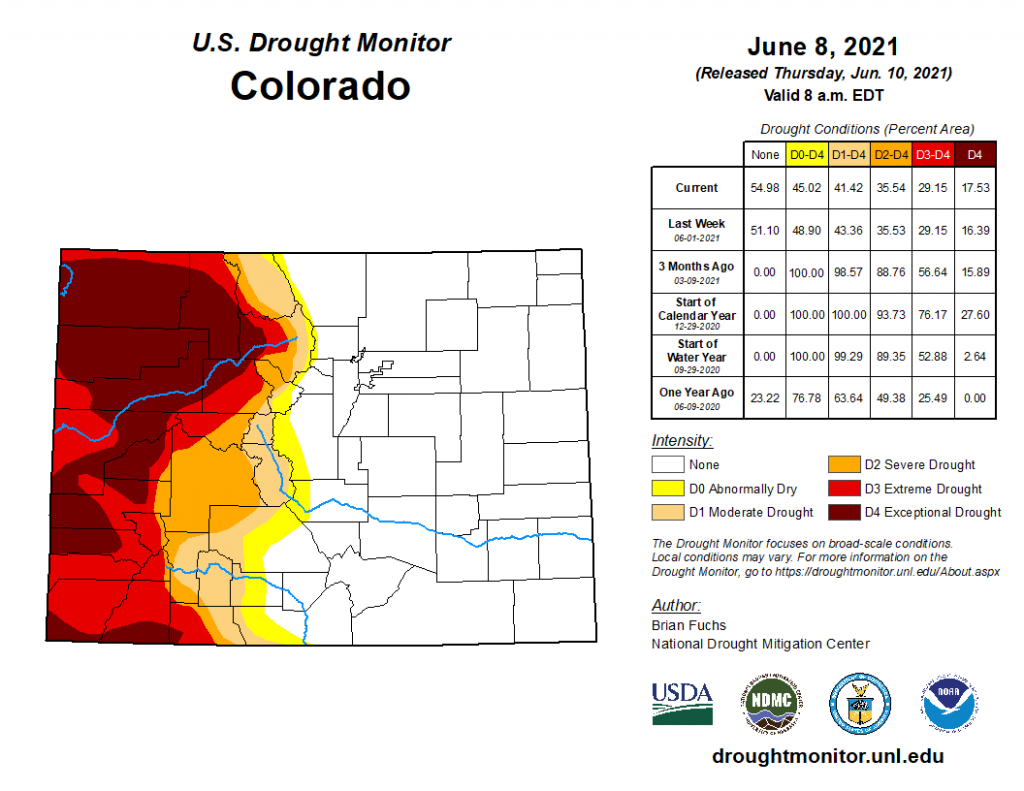
This week’s update of the U.S. Drought Monitor is below, which is valid through Tuesday morning. There is little change from last week, and the drastic difference between the eastern and western halves of the state is apparent. Still, there were some small improvements in drought conditions, particularly along the New Mexico Border. However, the area of D4 “exceptional drought” conditions on the Western Slope increased in area by about 1%.

The exceptional drought is taking its toll on water resources. The Yampa, Colorado, Gunnison, Uncompahgre, and Dolores rivers are among many on the western half the state with much below normal (<10th percentile) streamflow this time of year.

Click Here For Map Overview

The map below shows radar-estimated, rainfall gage-adjusted Quantitative Precipitation Estimates (QPE) across Colorado. The map is updated daily during the operational season (May 1 – Sep 30) by 11AM. The following six layers are currently available: 24-hour, 48-hour and 72-hour total precipitation, as well as maximum 1-hour, 2-hour and 6-hour precipitation over the past 24 hour period (to estimate where flash flooding may have occurred). The 24-hour, 48-hour and 72-hour total precipitation contain bias corrections that are not disaggregated into the hourly estimates, so there will likely be some differences. The accumulation ending time is 7AM of the date shown in the bottom right corner. Also shown optionally are vulnerable fire burn areas (post 2012), which are updated throughout the season to include new, vulnerable burn areas. The home button in the top left corner resets the map to the original zoom.

SPM 06-09-2021: Hot and Dry Across State

Issue Date: Wednesday, June 9, 2021
Issue Time: 9:15AM MDT

Summary:

Yesterday was another hot and dry day across nearly the entire state, as high pressure in the southwest continued to stifle changes in the large-scale pattern. There were only a handful of isolated Trace to 0.20 inch precipitation observations scattered across the state by CoCoRaHS observers and other networks.

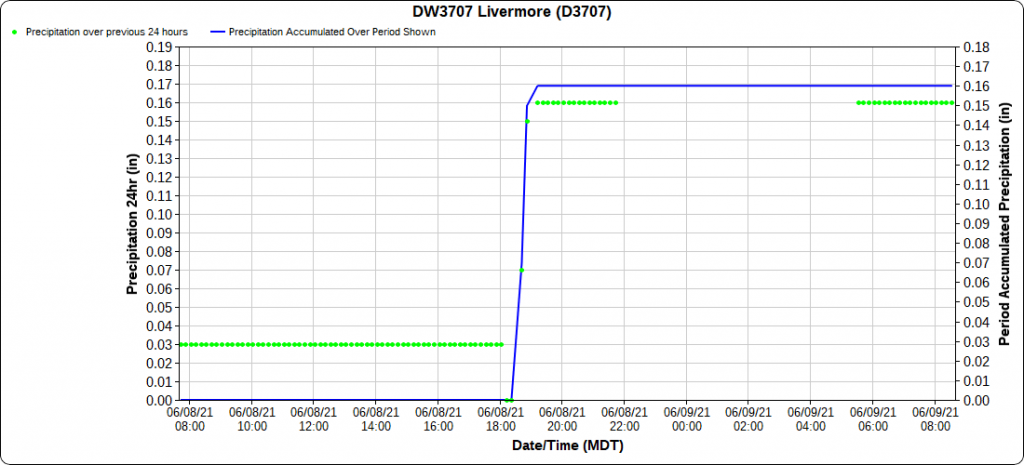
The 4:00 pm update to the Flood Threat Bulletin yesterday indicated a cumulus field over the northern Front Range, Medicine Bow, and Laramie Mountains. This eventually developed enough to drop a very quick 0.17 inches of rain at Livermore in northern Larimer County shortly after 6:00 pm, as seen in the time series plot below. However, the heaviest precipitation associated with these cells ended up falling north of the border in Wyoming.

No severe weather warnings were issued, and no flooding was reported yesterday. For rainfall estimates in your area, including antecedent rainfall conditions, check out the State Precipitation Map below.

Click Here For Map Overview

The map below shows radar-estimated, rainfall gage-adjusted Quantitative Precipitation Estimates (QPE) across Colorado. The map is updated daily during the operational season (May 1 – Sep 30) by 11AM. The following six layers are currently available: 24-hour, 48-hour and 72-hour total precipitation, as well as maximum 1-hour, 2-hour and 6-hour precipitation over the past 24 hour period (to estimate where flash flooding may have occurred). The 24-hour, 48-hour and 72-hour total precipitation contain bias corrections that are not disaggregated into the hourly estimates, so there will likely be some differences. The accumulation ending time is 7AM of the date shown in the bottom right corner. Also shown optionally are vulnerable fire burn areas (post 2012), which are updated throughout the season to include new, vulnerable burn areas. The home button in the top left corner resets the map to the original zoom.

Note: The 24-hour, 48-hour and 72-hour total precipitation do not contain bias corrections today due to errors in the CoCoRaHS data. This means there may be underestimations in QPE over the southwest and southeast corners of the state.