Issue Date: Saturday, June 12, 2021
Issue Time: 8:05 AM MDT
Summary:
Friday, June 11 was a cooler day across state, high temperatures were nearly 10-15 degrees cooler than the previous few days. There was no precipitation across the state after the frontal-passage left much dryer air behind it. There was no flooding reported on Friday. For precipitation totals in your area, check out the State Precipitation Map at the end of today’s post.
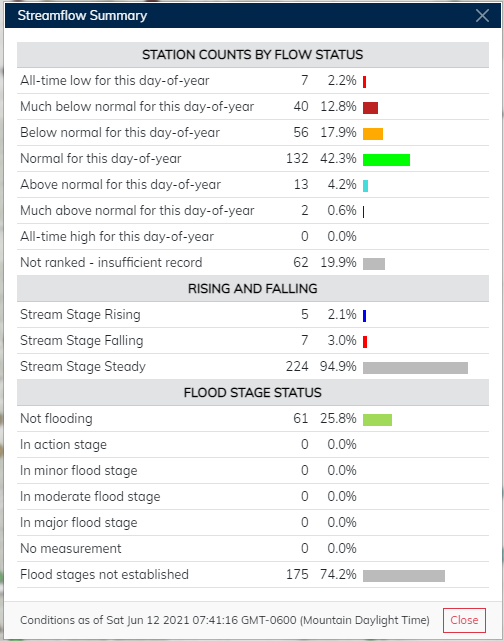
With very little precipitation in the last few days, here is a summary of streamflow from the USGS National Water Dashboard for the 312 streamflow gauges recording across the state (table below). Most of the streamflow gauges in the state are normal for this day-of-year, 132 out of 312, with a majority of them located in the North, Central, and Front Range Mountains, as well as the Urban Corridor and Southeast Plains. This makes sense considering the lack of drought conditions on the eastern half of the state. A total of 103 out of 312 gauges are in some way below normal for this day-of-year, including 7 gauges recording all time lows. Nearly all of these gauges are west of the divide, on the Western Slope or the Grand Valley, where drought conditions are extreme. By contrast, only 15 total of 312 gauges across the state are above normal. Given the lack of precipitation across the state, it also makes sense that the vast majority (nearly 95%) of gauges have a steady stream stage, rather than rising or falling. The interactive water dashboard for Colorado is found here.
Click Here For Map Overview

