SPM 07-02-2021: Widespread Heavy Rain and Flooding

Issue Date: Friday, July 2, 2021
Issue Time: 10:45 AM MDT

Summary:

Yesterday kicked off with an early morning storm in the Grand Valley – a trained spotter reported a quick 0.24 inches of heavy rain in Grand Junction before dissipating around 8:00 am. There was also an early morning line of storms associated with a low-pressure system in the Southeast Plains, which moved eastward into Kansas through the morning. In the late morning and early afternoon things really started to kick off in the Northern and Front Range Mountains, Urban Corridor, Southeast Mountains, and Southeast Plains. By 11:00 am, lines of thunderstorms, some severe, were building and producing heavy rainfall. Fueled by additional monsoonal moisture, storms strengthened throughout the day until they finally dissipated from north to south overnight.

The big “winner” of the day in terms of total storm precipitation was Greeley, which recorded between 2-3+ inches across town in just a few hours. A CoCoRaHS observer in West Greeley reported a total of 3.40 inches, and a nearby Weather Underground PWS recorded 3.43 inches in just under 3-hours. To put that into perspective, 3.43 inches in 3-hours relates to a 90-year rainfall event, or only a 1.1% chance of occurring in any given year!

Flash flood warnings were issued for the heavy rain, and several reports were made across Greeley of significant road flooding. The following tweet from Marc Sallinger shows some of the flooding and damage reported.

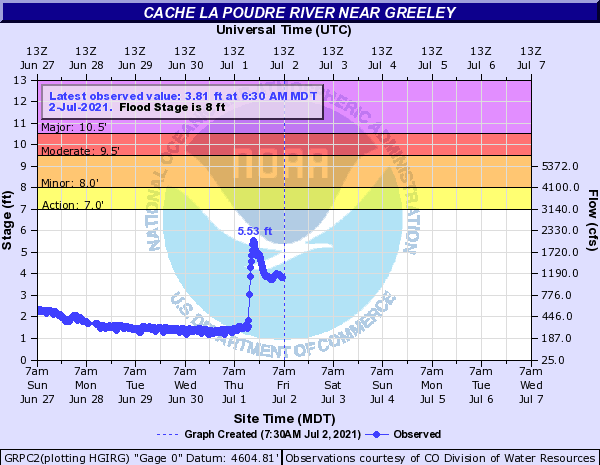
While the Cache la Poudre River near Greeley did not make it to action or flood stage, the river’s response to the heavy rain can be seen in the hydrograph below, showing the rapid increase in river stage, which peaked at 5.53 feet last night.
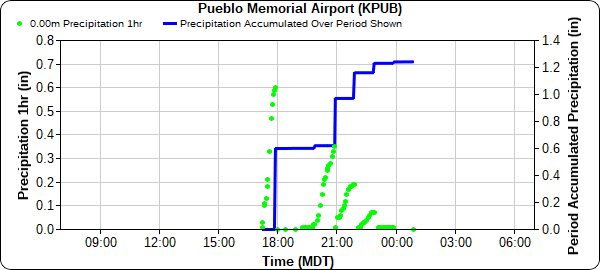
Heavy rainfall and flooding was also reported in Pueblo, which recorded a new record high rainfall for the day. At around 9:30 pm, the NWS Pueblo office tweeted that the Pueblo Memorial Airport had received 1.10 inches for the day, breaking the previous record. Ultimately, the airport received 1.24 inches in in about 4-hours, as seen in the time series plot below.

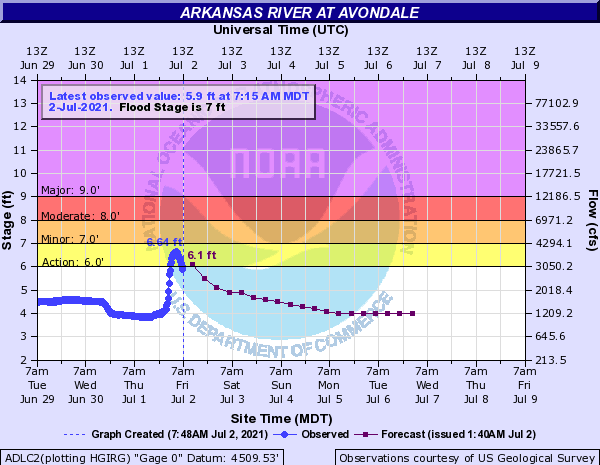
Though it broke the daily rainfall record, 1.24 inches was not particularly rare of an event. Precipitation Frequency Estimates from NOAA 14 at Pueblo have the 2-year, 6-hour rainfall event at 1.31 inches. Still, street flooding was reported and resulted in road closures. Nearby, the Arkansas River at Avondale reached action stage overnight, peaking at 6.64 feet, just below the minor flood stage of 7.0 feet.

Another cell dropped heavy rainfall between Boulder and the West Denver Suburbs, causing flash flooding. A MHFD gauge in Westminster recorded 2.05 inches in 24-hours, but a majority of that fell in just 2-hours, with a single hourly observation of 1.85 inches/hour. 1-hour precipitation frequency estimates in this area put this just above a 25-year event. A CoCoRaHS observer in east Boulder also reported 2.05 inches and they left the following remark emphasizing the heavy rainfall and wet year so far on their daily report:
Crazy heavy thunderstorm with 1.91″ of rain between near the start ~1600 to 1645. A little tiny hail at times midway through the event. Did not notice any substantial flooding but lots of dramatic runoff. Thunder and R- lingered until about 1700 (another 0.04), then another thunderstorm more to our south dropped 0.10″ ~1800-1830. Now have over 18″ since 1 Jan, more than my 17 year average of ~17.50 and blowing by last year’s 14.36″. A MHFD gauge over the Calwood fire burn area recorded 0.75 inches over a 4-hour period.

Further west, Buena Vista and Salida saw heavy rain and flooding. Up to 2.46 inches was recorded in Salida by CoCoRaHS observers, who also remarked that they have “Never witnessed this much rain come down in the 45 years we’ve lived at this location! Began about 8:00pm and poured for about an hour with lightning, thunder and wind”. 2.46 inches in 2-hours relates to an approximately 145-year rainfall event, or 0.7% chance of occurrence! Country Roads 28, 110, 111, 304 were reported as flooded and washed out in Chaffee County.

The list of areas receiving heavy rainfall is extensive across the eastern portion of the state. East of Denver, 3.71 inches was reported in rural Arapahoe County from a storm that also warranted severe thunderstorm and flash flood warnings. All the way down to the Colorado-New Mexico border, Trinidad received up to 1.80 inches, also reported by CoCoRaHS observers.

Almost miraculously, there was no flooding reported on the many fire burn scars. Thunderstorms over the Muddy Slide fire were described as a “mixed blessing” – while rainfall helps to slow the spread, it is not usually enough to extinguish fires completely and increases the risk of lightning and high winds. Conditions were similar for the Sylvan fire, which has also received light rain over several days.

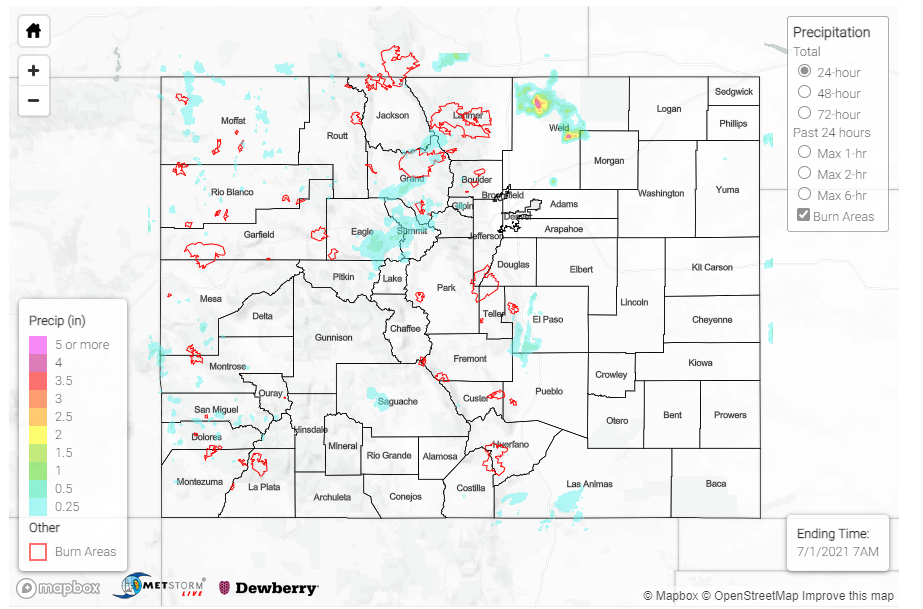
What a day! For rainfall estimates in your area, check out the State Precipitation Map below


Click Here For Map Overview

The map below shows radar-estimated, rainfall gage-adjusted Quantitative Precipitation Estimates (QPE) across Colorado. The map is updated daily during the operational season (May 1 – Sep 30) by 11AM. The following six layers are currently available: 24-hour, 48-hour and 72-hour total precipitation, as well as maximum 1-hour, 2-hour and 6-hour precipitation over the past 24 hour period (to estimate where flash flooding may have occurred). The 24-hour, 48-hour and 72-hour total precipitation contain bias corrections that are not disaggregated into the hourly estimates, so there will likely be some differences. The accumulation ending time is 7AM of the date shown in the bottom right corner. Also shown optionally are vulnerable fire burn areas (post 2012), which are updated throughout the season to include new, vulnerable burn areas. The home button in the top left corner resets the map to the original zoom.
a href=”http://www.dewberry-hydromet.com/STP/Snapshots/SPM/SPM_202100702_snap.png”>

SPM 07-01-2021: Flash Flood in Rural Weld County

Issue Date: Thursday, July 1, 2021
Issue Time: 9:35 AM MDT

Summary:

The last day of June started off uneventfully, but ample moisture across the state allowed for isolated and scattered thunderstorm development in the western half of the state in the late afternoon, including the Northwest and Southwest Slopes, and Northern and Central Mountains. Pockets of isolated thunderstorm accumulation of 0.25 inches or more can be seen scattered across the State Precipitation Map below. CoCoRaHS observers saw even higher, localized rainfall totals with 0.98 inches reported in Mancos and 0.85 inches in Del Norte.

By evening, a slow-moving, convective thunderstorm formed in rural Weld County, north of Greeley. A series of flash flood warnings and updates were issued for the heavy rainfall beginning at 8:20 pm and extending well into overnight. In total, 3.46 inches fell according to two CoCoRaHS observers in Nunn and Purcell in Weld County, and an additional 2.24 from a second observer in Nunn. One remarked “In 70 years I’ve never seen a rain like this”.

A radar loop of the slow-moving, convective cell was shared by State Climatologist Russ Schumacher this morning, highlighting how stationary the storm was:

NWS flood reports indicated a flash flood on Coal Creek in Purcell. There, a trained spotter also reported more than 5 inches of rain mostly between 8 and 10 pm! Flash flooding was strong enough to move cars and heavy equipment and lasted well into the night.

The 6-hour 50-year average recurrence interval precipitation in Nunn, CO (from NOAA Atlas 14) is 3.41 inches. If it is assumed that all over the precipitation fell in 6-hours, 3.46 inches is just over a 54-year event (or 0.18% chance of occurring in any given year). Even if we look at this storm in terms of 12-hour precipitation, it’s still well over the 25-year recurrence interval value of 3.02 inches

While the most impressive, the Weld County storm was not the only heavy rainfall producing cell over the state. A similar, slow-moving and highly convective thunderstorm occurred in the evening over the southern Front Range Mountains and Urban Corridor. Observers in Cañon City reported around 1.20 inches with impressive lightning, and rainfall totals over Colorado Springs ranged from around 0.1 to 0.8 inches as well.

For rainfall estimates in your area, check out the State Precipitation Map below.

Click Here For Map Overview

The map below shows radar-estimated, rainfall gage-adjusted Quantitative Precipitation Estimates (QPE) across Colorado. The map is updated daily during the operational season (May 1 – Sep 30) by 11AM. The following six layers are currently available: 24-hour, 48-hour and 72-hour total precipitation, as well as maximum 1-hour, 2-hour and 6-hour precipitation over the past 24 hour period (to estimate where flash flooding may have occurred). The 24-hour, 48-hour and 72-hour total precipitation contain bias corrections that are not disaggregated into the hourly estimates, so there will likely be some differences. The accumulation ending time is 7AM of the date shown in the bottom right corner. Also shown optionally are vulnerable fire burn areas (post 2012), which are updated throughout the season to include new, vulnerable burn areas. The home button in the top left corner resets the map to the original zoom.

Note: The 24-hour, 48-hour and 72-hour total precipitation do not contain bias corrections today due to errors in the CoCoRaHS data. This means there may be underestimations in QPE over the southwest and southeast corners of the state.

SPM 06-30-2021: Heavy Rain in Northern Mountains, Monsoonal Moisture in South

Issue Date: Wednesday, June 30, 2021
Issue Time: 9:30 AM MDT

Summary:

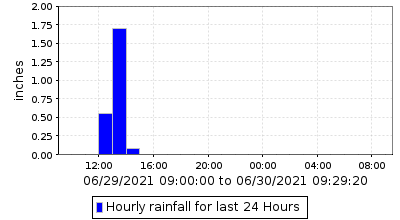
High elevation thunderstorms began to develop in the early afternoon yesterday. A cell west of Conifer produced very heavy, short-duration rainfall and was able to be observed by both CoCoRaHS and UDFCD networks. The Brook Forest Precipitation Station west of Conifer recorded 2.32 inches in 24-hours with most of it, 1.69 inches, falling within a single hour, as seen in the 24-hour time series plot below. Nearby, a CoCoRaHS station recorded 1.29 inches in 24-hours, with a remark that “All but .01 of rain was received in less then an hour in the afternoon.”

According to NOAA Atlas 14 precipitation frequency estimates for this area, a 1-hour rainfall rate of 1.69 inches is approximately a 47-year rainfall event (or 0.21% chance of occurring in any given year). A flood advisory was issued associated with this heavy rain, but no flooding was reported.

Similar high elevation, high rainfall rate storms developed throughout the Northern, Central, and Front Range mountains in the afternoon and evening. A flood advisory was also issued for the East Troublesome burn area yesterday, but again no flooding reported. Lastly, a flash flood warning was issued again for the Grizzly Creek burn area in Glenwood Canyon. Thankfully no flooding was reported yesterday, and I-70 has remained open since the two closures over the weekend from mud and debris flows.

The Southwest Slope continued to benefit from monsoonal moisture making its way up from the southwest. Widespread, long lasting storms began in the afternoon and dropped 0.25-0.50 inches, with localized even higher rainfall amounts. While hourly rainfall rates were low, 0.68 inches was recorded at a Mancos CO-OP station and up to 0.94 inches at nearby CoCoRaHS stations. Portions of the Grand Valley also received beneficial moisture.

No flooding was reported on Tuesday. For rainfall estimates in your area, check out the State Precipitation Map below.

Click Here For Map Overview

The map below shows radar-estimated, rainfall gage-adjusted Quantitative Precipitation Estimates (QPE) across Colorado. The map is updated daily during the operational season (May 1 – Sep 30) by 11AM. The following six layers are currently available: 24-hour, 48-hour and 72-hour total precipitation, as well as maximum 1-hour, 2-hour and 6-hour precipitation over the past 24 hour period (to estimate where flash flooding may have occurred). The 24-hour, 48-hour and 72-hour total precipitation contain bias corrections that are not disaggregated into the hourly estimates, so there will likely be some differences. The accumulation ending time is 7AM of the date shown in the bottom right corner. Also shown optionally are vulnerable fire burn areas (post 2012), which are updated throughout the season to include new, vulnerable burn areas. The home button in the top left corner resets the map to the original zoom.

SPM 06-29-2021: Rain in Northeast and Southwest Corners of State

Issue Date: Tuesday, June 29, 2021
Issue Time: 9:20 AM MDT

Summary:

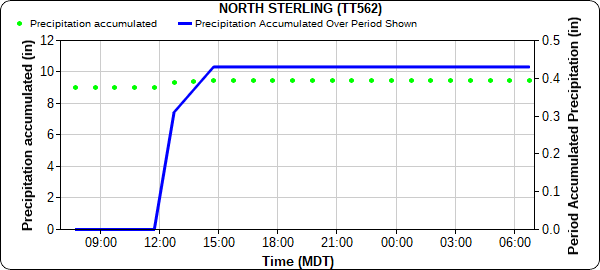
Yesterday began with a north-south oriented line of thunderstorms developing in the late morning on the Colorado-Nebraska border east of Pawnee National Grasslands. As the line moved eastward, North Sterling picked up a quick 0.44 inches in a little under 3-hours as the storms passed, as seen in the plot below. Nearby, rainfall totals in the area end up around 0.25-0.50 inches.

By early afternoon, scattered showers also formed along the Front Range Mountains before making their way eastward across the Urban Corridor and Northeast Plains. A flood advisory was issued in Larimer County due to rain over the eastern side of the Cameron Peak burn area, however no flooding was ultimately reported. Rainfall rates in the Urban Corridor were low, also resulting in minimal accumulations.

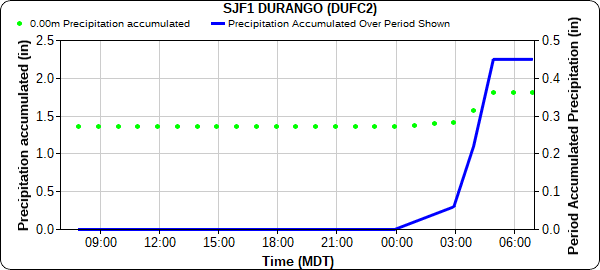
Overnight into the early morning hours, storms on the Southwest Slope provided a quick burst of rainfall. Durango received 0.45 inches overnight shortly after 3:00 am, seen below. Similar rainfall totals, 0.25-0.50 inches, were scatted across Montezuma, La Plata, and Dolores Counites.

No flooding was reported on Monday. For rainfall estimates in your area, including antecedent conditions, check out the State Precipitation Map below.

Click Here For Map Overview

The map below shows radar-estimated, rainfall gage-adjusted Quantitative Precipitation Estimates (QPE) across Colorado. The map is updated daily during the operational season (May 1 – Sep 30) by 11AM. The following six layers are currently available: 24-hour, 48-hour and 72-hour total precipitation, as well as maximum 1-hour, 2-hour and 6-hour precipitation over the past 24 hour period (to estimate where flash flooding may have occurred). The 24-hour, 48-hour and 72-hour total precipitation contain bias corrections that are not disaggregated into the hourly estimates, so there will likely be some differences. The accumulation ending time is 7AM of the date shown in the bottom right corner. Also shown optionally are vulnerable fire burn areas (post 2012), which are updated throughout the season to include new, vulnerable burn areas. The home button in the top left corner resets the map to the original zoom.