Issue Date: Thursday, July 1, 2021
Issue Time: 9:35 AM MDT
Summary:
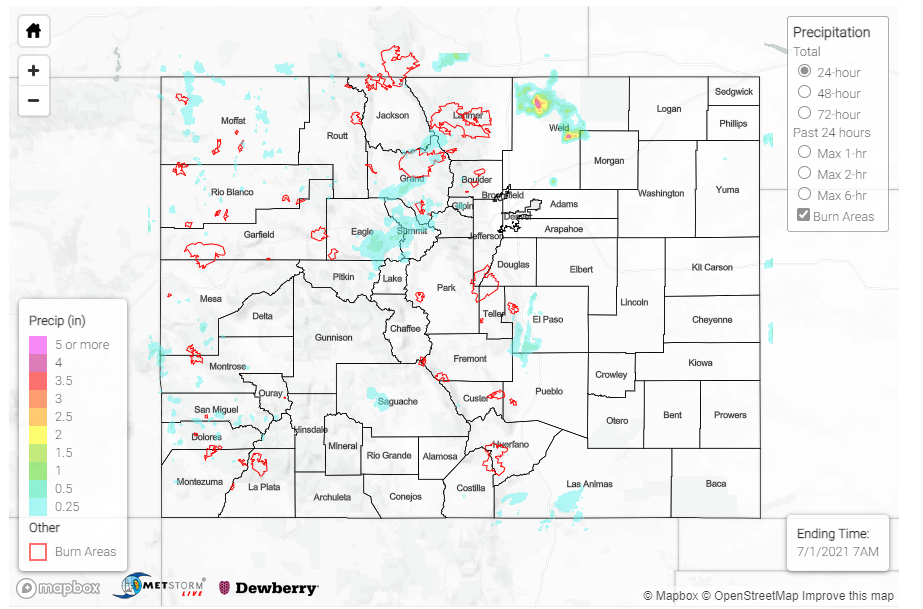
The last day of June started off uneventfully, but ample moisture across the state allowed for isolated and scattered thunderstorm development in the western half of the state in the late afternoon, including the Northwest and Southwest Slopes, and Northern and Central Mountains. Pockets of isolated thunderstorm accumulation of 0.25 inches or more can be seen scattered across the State Precipitation Map below. CoCoRaHS observers saw even higher, localized rainfall totals with 0.98 inches reported in Mancos and 0.85 inches in Del Norte.
By evening, a slow-moving, convective thunderstorm formed in rural Weld County, north of Greeley. A series of flash flood warnings and updates were issued for the heavy rainfall beginning at 8:20 pm and extending well into overnight. In total, 3.46 inches fell according to two CoCoRaHS observers in Nunn and Purcell in Weld County, and an additional 2.24 from a second observer in Nunn. One remarked “In 70 years I’ve never seen a rain like this”.
A radar loop of the slow-moving, convective cell was shared by State Climatologist Russ Schumacher this morning, highlighting how stationary the storm was:
Pretty remarkable little convective system over Weld County last night… #cowx 1/2 pic.twitter.com/uoH1v2bUjs
— Russ Schumacher (@russ_schumacher) July 1, 2021
NWS flood reports indicated a flash flood on Coal Creek in Purcell. There, a trained spotter also reported more than 5 inches of rain mostly between 8 and 10 pm! Flash flooding was strong enough to move cars and heavy equipment and lasted well into the night.
The 6-hour 50-year average recurrence interval precipitation in Nunn, CO (from NOAA Atlas 14) is 3.41 inches. If it is assumed that all over the precipitation fell in 6-hours, 3.46 inches is just over a 54-year event (or 0.18% chance of occurring in any given year). Even if we look at this storm in terms of 12-hour precipitation, it’s still well over the 25-year recurrence interval value of 3.02 inches
While the most impressive, the Weld County storm was not the only heavy rainfall producing cell over the state. A similar, slow-moving and highly convective thunderstorm occurred in the evening over the southern Front Range Mountains and Urban Corridor. Observers in Cañon City reported around 1.20 inches with impressive lightning, and rainfall totals over Colorado Springs ranged from around 0.1 to 0.8 inches as well.
For rainfall estimates in your area, check out the State Precipitation Map below.
Click Here For Map Overview
Note: The 24-hour, 48-hour and 72-hour total precipitation do not contain bias corrections today due to errors in the CoCoRaHS data. This means there may be underestimations in QPE over the southwest and southeast corners of the state.
