Issue Date: Sunday, September 11th, 2022
Issue Time: 10:45 AM MDT
Summary:
Saturday saw a continuation of fall-like weather, with cool temperatures and gloomy conditions east of the Divide from the Front Range out into the Plains. In fact, many locations saw their coolest high temperatures since May or early June, with highs struggling to reach 60. Overcast and light rain lingered throughout much of the day, with 0.20-0.40” observed from the Front Range southward along the Urban Corridor and southern I-25 corridor. The heaviest rain appears to have accumulated in the vicinity of Colorado Springs, where a CoCoRaHS observer measured 0.60” near Falcon Estates. For the Plains, amounts were generally 0.10” or less.
West of the Divide was a much different story, with sunshine and milder temperatures making for a more pleasant September Saturday. Check out this webcam shot from Loveland Pass capturing the east/west difference in weather across the state:
Loveland Pass is on the edge of two weather worlds: Low clouds and drizzle will persist across the east slopes of the Front Range and plains today. Above about 11,000 feet and west of the Continental Divide it will be another sunny, mild day. #cowx
📸https://t.co/uoUwxQXFoP pic.twitter.com/1VVnio3vQV— NWS Boulder (@NWSBoulder) September 10, 2022
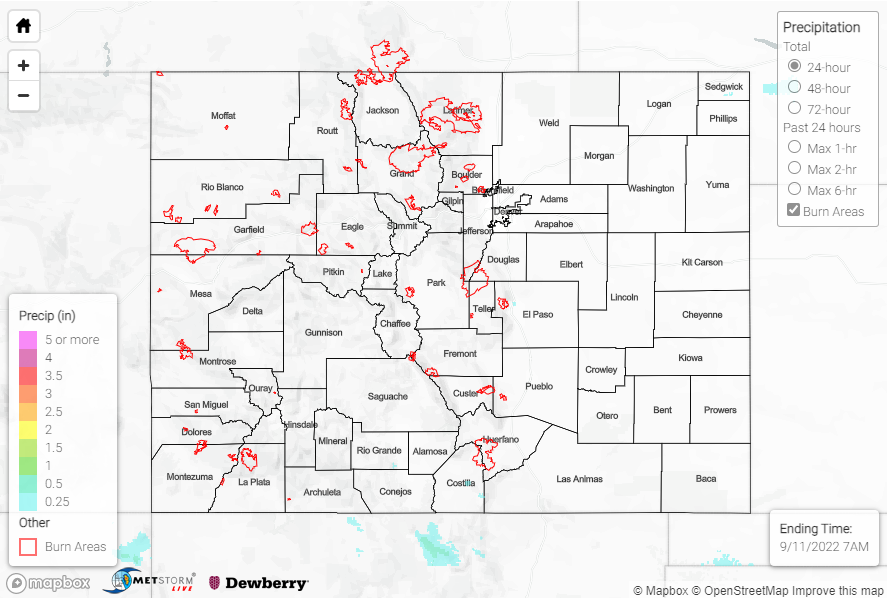
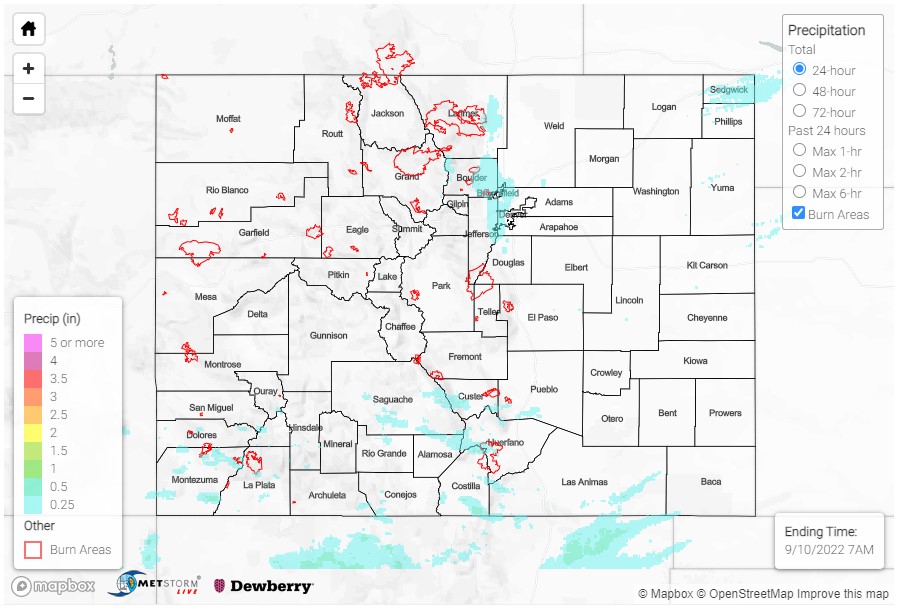
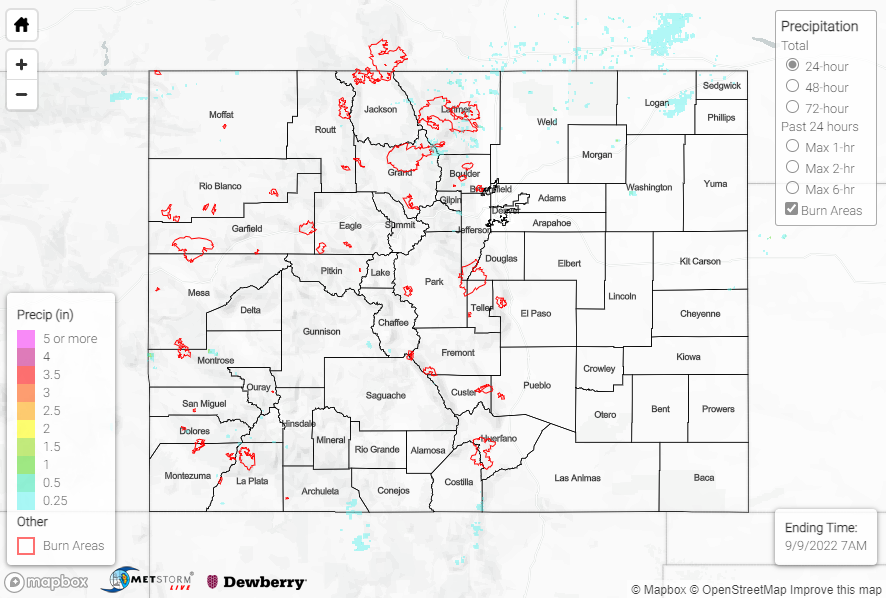
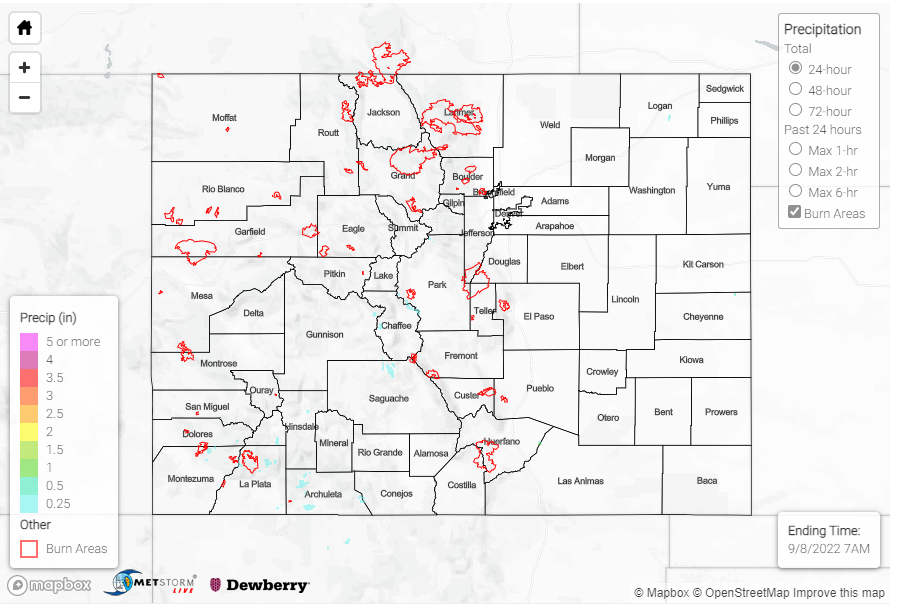
No flooding was reported yesterday. For precipitation estimates in our area, check out the map below. Remember, if you observe flooding in your area, you can use the “Report a Flood” page to make a flood report when you can safely do so.
Click Here For Map Overview