Issue Date: Saturday, September 10th, 2022
Issue Time: 11:55 AM MDT
Summary:
After Thursday’s record-breaking heat, a much welcome cool down came to the state Friday following an early morning cold-frontal passage, which significantly cooled temperatures and brought broad overcast, gloomy conditions to much of Eastern Colorado. Daily highs for the Front Range, Urban Corridor, and Northeast Plains were in the 50s and 60s, compared to 90s just the day before. In the afternoon through evening, the Southeast Mountains and southern I-25 corridor saw showers and thunderstorms, with up to 0.31 inches reported in Colorado City.
Overnight upslope flow from a shortwave trough dipping in from the north brought long-duration, soaking rainfall overnight to the Front Range, Urban Corridor, and Northeast Plains. From north to south, some impressive rainfall totals from CoCoRaHS for the Urban Corridor include:
- 0.82 in Fort Collins
- 0.90 in Boulder
- 0.94 in Lakewood
- 0.61 in Littleton
Western Colorado saw a bit of a cool-down as well yesterday, though not as significant – highs were in the 80s and low 90s. The west also stayed largely dry with the exception of the very Southwest Slope and San Juan Mountains, where afternoon storms were able to fire up from the moisture associated with the tropical remnants of Kay. Up to 0.44 was reported from CoCoRaHS observer in Durango.
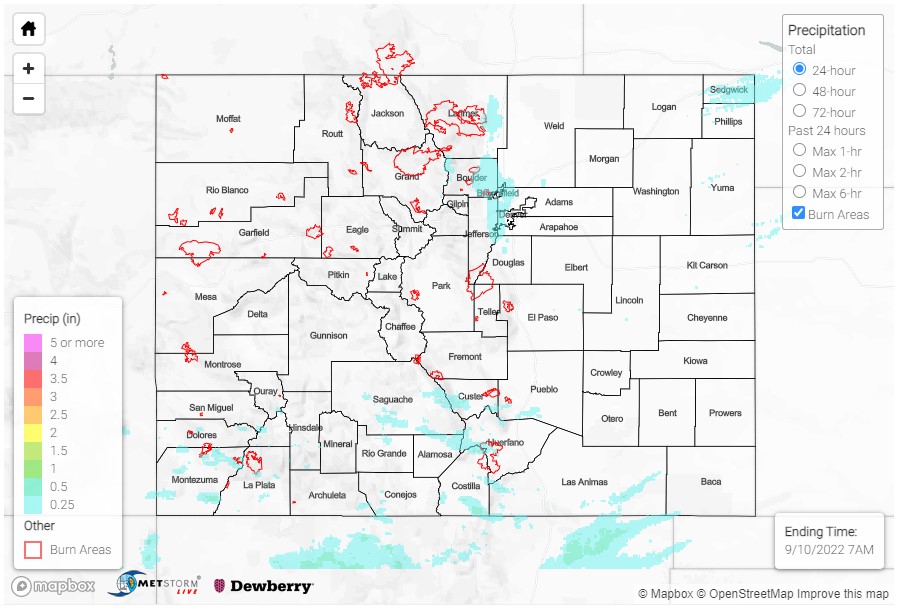
No flooding was reported yesterday. For precipitation estimates in our area, check out the map below. Remember, if you observe flooding in your area, you can use the “Report a Flood” page to make a flood report when you can safely do so.
Click Here For Map Overview