SPM 07-18-2021: Palmer Ridge and Eastern Plains Thunderstorms

Issue Date: Sunday, July 18, 2021
Issue Time: 10:00 AM MDT

Summary:

Saturday was another very typical summer day in Colorado. In the early afternoon, isolated to scattered storms began to develop over the high elevations, helped by available monsoonal moisture. Storms remained scattered but widespread in the Western Slopes, Grand Valley, Central and San Juan Mountains, and those areas lucky enough to be under a cell picked up moderate rainfall.

Storm movement was eastward, eventually breaking over the Front Range, Urban Corridor, and then onto the Palmer Ridge and Eastern Plains where the heaviest rainfall occurred.

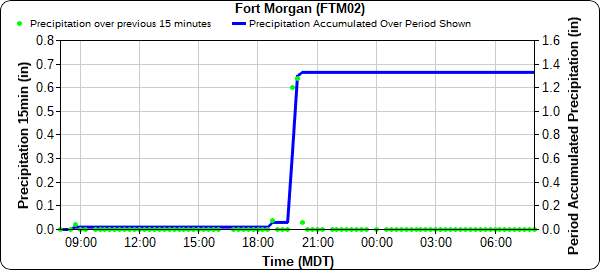
Storms along the I-76 corridor in the Northeast Plains had some of the highest rainfall rates seen yesterday. 1.78 inches was reported by a CoCoRaHS observer in Fort Morgan, and several surrounding observers reported between 0.72-1.55 inches. A gauge-owned by Northern Water in Fort Morgan reported a total of 1.31 inches, with 1.27 of that falling in just 45 minutes, as seen in the time series plot below. The 60-minute, 10-year Average Recurrence Interval from NOAA Atlas 14 in Fort Morgan is 1.56 inches – so portions of Fort Morgan received well above a 10-year rainfall (or 10% chance of occurring in any given year).

Nearby, Adena in eastern Adams County saw 1.49 inches, as reported by a CoCoRaHS observer.

Further south on the Palmer Ridge, storms produced street flooding in Colorado Springs. Approximately 0.20-0.30 fell over the eastern urban area of Colorado Springs. Heavy rain and severe thunderstorms were also present on the Southeast Plains, observers reported 1.24 inches in Cedarwood in southern Pueblo County. Reports of hail up to 1-inch were also made following a severe-warned thunderstorm in Pritchett in Baca County.

Flooding was not reported on any burn scars yesterday. For rainfall estimates in your area, check out the State Precipitation Map below.

Click Here For Map Overview

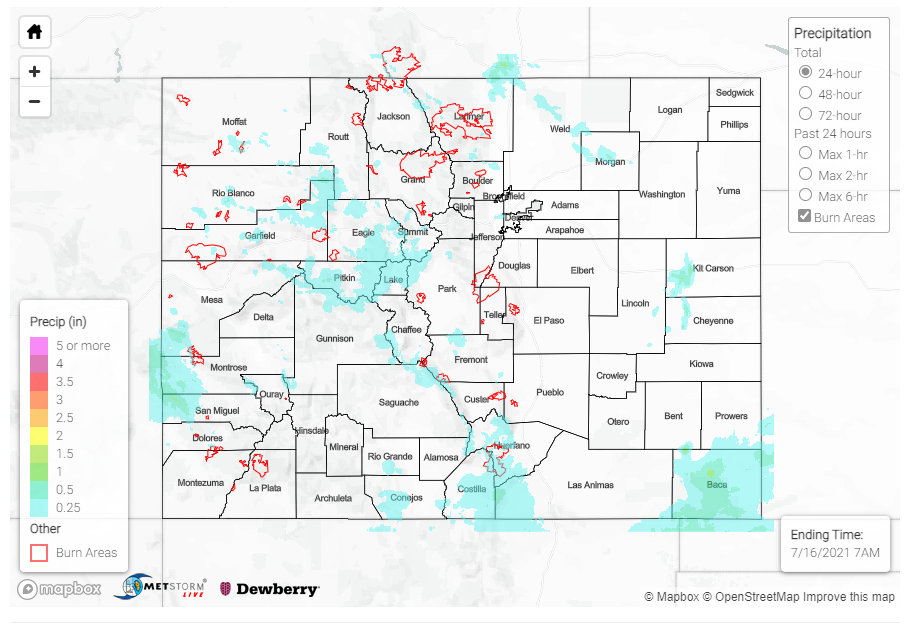
The map below shows radar-estimated, rainfall gage-adjusted Quantitative Precipitation Estimates (QPE) across Colorado. The map is updated daily during the operational season (May 1 – Sep 30) by 11AM. The following six layers are currently available: 24-hour, 48-hour and 72-hour total precipitation, as well as maximum 1-hour, 2-hour and 6-hour precipitation over the past 24 hour period (to estimate where flash flooding may have occurred). The 24-hour, 48-hour and 72-hour total precipitation contain bias corrections that are not disaggregated into the hourly estimates, so there will likely be some differences. The accumulation ending time is 7AM of the date shown in the bottom right corner. Also shown optionally are vulnerable fire burn areas (post 2012), which are updated throughout the season to include new, vulnerable burn areas. The home button in the top left corner resets the map to the original zoom.

SPM 07-17-2021: Another Round of Severe Storms on the Eastern Plains

Issue Date: Saturday, July 17, 2021
Issue Time: 9:50 AM MDT

Summary:

Friday afternoon began with light rain across the Southwest Slope, San Juan Mountains, Northern Mountains, Central Mountains, and Palmer Divide, fueled by monsoonal moisture which produced isolated to scattered storms. Rainfall totals in these areas were light, ranging from Trace – 0.25 inches, and up to 0.35 inches reported north of Durango in the Southwest Slope.

However, the real story of the day was severe storms and very heavy rain on the Eastern Plains. As general storm motion moved eastward off the high elevations and on to the plains, storms tapped into additional moisture and elevated instability. Storms were also very slow-moving, which combined to create high rainfall totals.

At 7:15 pm, heavy rain was reported in Bethune by a trained spotter – 1.70 inches over an approximately 3-hour period. That rainfall rate (1.70”/3-hours) in this region is between a 2-year and 5-year Average Recurrence Interval (ARI; or 50%-20% chance of occurrence in any given year). Just east of Bethune along I-70, 1.40 inches of rain was reported in Burlington, along with flash floods:

1.4 INCHES OF STORM TOTAL RAIN WAS REPORTED IN THE OWNERS RAIN GAUGE. REPORTED VIA SOCIAL MEDIA WITH PHOTO. HEAVY RAIN PRODUCED ENOUGH RAIN FOR WATER TO REACH THE RUNNING BOARDS ON A JEEP. ESTIMATED 4-6 INCHES. -Public Report

1.41 was also reported by a CoCoRaHS observer in Burlington, verifying the high rainfall total reported by the public. Flash flood warnings and severe thunderstorm warnings were also issued, with the largest threats aside from heavy rain being high winds and large hail. Over 50 mph wind gusts were reported along with pea to dime sized hail.

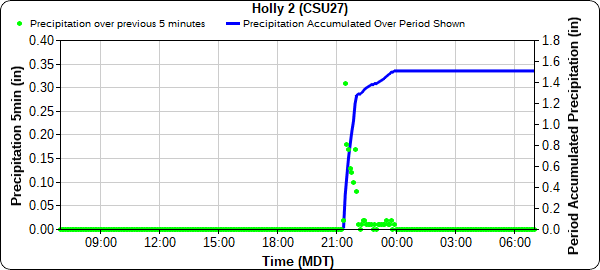
Further south, another 1.70 inches was reported by a CoCoRaHS observer in Holly. A nearby CoAgMet Station reported 1.51 inches, again with nearly all of the precipitation falling in a 3-hour period (see time series plot below). 1.70 inches in 3-hours in Hollyalso amounts to just over a 2-year rainfall event, or 50% chance of occurring in any given year based on Precipitation Frequency Estimates from NOAA Atlas 14. The fairly low ARIs shows that while the rainfall totals are high, they are not particularly rare events for this part of the state.
Other notable rainfall totals from CoCoRaHS observers:

  • 1.42 in Arapahoe (Cheyenne County)
  • 1.37 in Arriba (Northern Lincoln County)
  • 1.20 in Haswell (Southern Lincoln County)

For rainfall estimates in your area, check out the State Precipitation Map below.

Click Here For Map Overview
The map below shows radar-estimated, rainfall gage-adjusted Quantitative Precipitation Estimates (QPE) across Colorado. The map is updated daily during the operational season (May 1 – Sep 30) by 11AM. The following six layers are currently available: 24-hour, 48-hour and 72-hour total precipitation, as well as maximum 1-hour, 2-hour and 6-hour precipitation over the past 24 hour period (to estimate where flash flooding may have occurred). The 24-hour, 48-hour and 72-hour total precipitation contain bias corrections that are not disaggregated into the hourly estimates, so there will likely be some differences. The accumulation ending time is 7AM of the date shown in the bottom right corner. Also shown optionally are vulnerable fire burn areas (post 2012), which are updated throughout the season to include new, vulnerable burn areas. The home button in the top left corner resets the map to the original zoom.

SPM 07-16-2021: Severe Thunderstorms Over Palmer Ridge and Eastern Plains

Issue Date: Friday, July 16, 2021
Issue Time: 9:30 AM MDT

Summary:

Isolated thunderstorms began to fire in the early afternoon on the Northwest Slope, Grand Valley and Northern Mountains, as well as the Palmer Ridge, including an early severe-warned thunderstorm around Limon. As the afternoon progressed, storms generally made their way eastward, filling in to the Front Range Mountains and spilling over to the Urban Corridor.

In the Grand Valley, radar indicated heavy rain warranted a Flash flood warning for the Pine Gulch burn area. However no flooding was ultimately reported. Due to the rural nature of burn scar, there are limited precipitation observations for the area.

Rainfall rates from afternoon storms that spilled on the Urban Corridor were low, which translated to low precipitation totals along the Front Range and Urban Corridor, Trace– 0.2 inch observations were reported from Fort Collins to Denver. Storms were more severe along the Palmer Ridge and produced heavier rainfall, Matt Minnillo shared the following video on twitter of heavy rain and hail causing street flooding in Colorado Springs.


Up to 0.97 inches was reported in Colorado Springs from a CoCoRaHS observer, with 0.2-0.45 inch observations scattered across the city. For rainfall estimates in your area, check out the State Precipitation Map at the bottom of today’s post.

The main risk from the severe storms on the Palmer Ridge and Southeast Plains was high winds and damaging hail. A 2 inch (hen egg) hail stone was observed by a trained spotter in Karval in Lincoln County. A supercell formed and split in rural Las Animas county, also producing heavy rain, large hail and high winds. The Pueblo NWS shared the following 3D radar interpolation of the splitting cells.

In the Northern and Central Mountains, fairly high humidity and seasonal temperatures over the Muddy Slide and Morgan Creek fires have helped to moderate fire behavior, even with isolated thunderstorms producing little rain and gusty outflows. There was still plenty of smoke in the air from these fires, and those in the surrounding Western State, causing poor air quality.

Click Here For Map Overview

The map below shows radar-estimated, rainfall gage-adjusted Quantitative Precipitation Estimates (QPE) across Colorado. The map is updated daily during the operational season (May 1 – Sep 30) by 11AM. The following six layers are currently available: 24-hour, 48-hour and 72-hour total precipitation, as well as maximum 1-hour, 2-hour and 6-hour precipitation over the past 24 hour period (to estimate where flash flooding may have occurred). The 24-hour, 48-hour and 72-hour total precipitation contain bias corrections that are not disaggregated into the hourly estimates, so there will likely be some differences. The accumulation ending time is 7AM of the date shown in the bottom right corner. Also shown optionally are vulnerable fire burn areas (post 2012), which are updated throughout the season to include new, vulnerable burn areas. The home button in the top left corner resets the map to the original zoom.
Note: The 24-hour, 48-hour and 72-hour total precipitation do not contain bias corrections today due to errors in the CoCoRaHS data. This means there may be underestimations in QPE over the southwest and southeast corners of the state.

SPM 07-15-2021: Afternoon Rains Cause Another Debris Flow in Glenwood Canyon

Issue Date: Thursday, July 15, 2021
Issue Time: 9:30 AM MDT

Summary:

Yesterday began with early morning precipitation in the Southwest Slope and Grand Valley associated with an upper-level low, which then made its way eastward throughout the day tapping into additional moisture and providing necessary lift ahead of the disturbance. By the afternoon, much of the Northern, Central, Front Range, and Southeast Mountains were experiencing widespread showers, with isolated embedded convection producing higher rainfall totals within. Storms also spilled over in to the Urban Corridor. A late evening lines of thunderstorms produced heavy rain on the Southeast Plains.

Another day of rain in the Central Mountains translated to another I-70 closure in Glenwood Canyon due to debris flows. A flood warning was issued at 3:35 pm for the Grizzly Creek burn area, which promptly caused CDOT to close I-70. The flood warning expired at 5:30 pm, however the interstate remained closed for more than 4 hours after the afternoon rain caused two “shallow” debris flows. I-70 has since been cleared and reopened around 8:00 pm last night.

Additional flood warnings issued across the state included an urban and small stream flood advisory issued in Denver. CoCoRaHS observers and UDFD gages measured between 0.20-0.74 inches across the Denver Metro Area. Warnings were also issued for the Pine Gulch burn scar in the Northwest Slope/Grand Valley, and the Spring Burn Scar in the Southeast Mountains, however no flooding was reported on these burn scars.

Some notable rainfall totals:

  • Heavy rain associated with a severe thunderstorm in Collbran, with 0.78 inches reported by a trained spotter.
  • 1.46 inches from a CoCoRaHS observer in Springfield, CO on the Southeast Plains and a nearby NWS/FAA gauge reported 2.41 inches in 24-hours. Most of the rain in Springfield fell in 3-hour period, which translates to an 8-year Average Recurrence Interval based on Precipitation Frequency Estimates from NOAA Atlas 14.

For rainfall estimates in your area, check out the State Precipitation Map below.

Click Here For Map Overview

The map below shows radar-estimated, rainfall gage-adjusted Quantitative Precipitation Estimates (QPE) across Colorado. The map is updated daily during the operational season (May 1 – Sep 30) by 11AM. The following six layers are currently available: 24-hour, 48-hour and 72-hour total precipitation, as well as maximum 1-hour, 2-hour and 6-hour precipitation over the past 24 hour period (to estimate where flash flooding may have occurred). The 24-hour, 48-hour and 72-hour total precipitation contain bias corrections that are not disaggregated into the hourly estimates, so there will likely be some differences. The accumulation ending time is 7AM of the date shown in the bottom right corner. Also shown optionally are vulnerable fire burn areas (post 2012), which are updated throughout the season to include new, vulnerable burn areas. The home button in the top left corner resets the map to the original zoom.