Issue Date: Sunday, July 18, 2021
Issue Time: 10:00 AM MDT
Summary:
Saturday was another very typical summer day in Colorado. In the early afternoon, isolated to scattered storms began to develop over the high elevations, helped by available monsoonal moisture. Storms remained scattered but widespread in the Western Slopes, Grand Valley, Central and San Juan Mountains, and those areas lucky enough to be under a cell picked up moderate rainfall.
Storm movement was eastward, eventually breaking over the Front Range, Urban Corridor, and then onto the Palmer Ridge and Eastern Plains where the heaviest rainfall occurred.
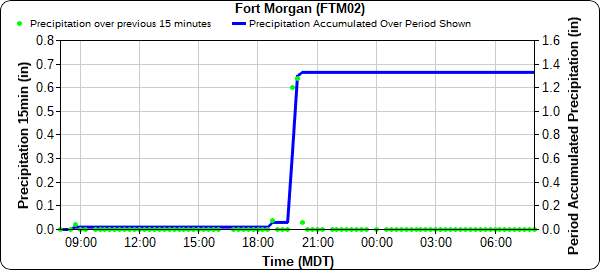
Storms along the I-76 corridor in the Northeast Plains had some of the highest rainfall rates seen yesterday. 1.78 inches was reported by a CoCoRaHS observer in Fort Morgan, and several surrounding observers reported between 0.72-1.55 inches. A gauge-owned by Northern Water in Fort Morgan reported a total of 1.31 inches, with 1.27 of that falling in just 45 minutes, as seen in the time series plot below. The 60-minute, 10-year Average Recurrence Interval from NOAA Atlas 14 in Fort Morgan is 1.56 inches – so portions of Fort Morgan received well above a 10-year rainfall (or 10% chance of occurring in any given year).

Nearby, Adena in eastern Adams County saw 1.49 inches, as reported by a CoCoRaHS observer.
Further south on the Palmer Ridge, storms produced street flooding in Colorado Springs. Approximately 0.20-0.30 fell over the eastern urban area of Colorado Springs. Heavy rain and severe thunderstorms were also present on the Southeast Plains, observers reported 1.24 inches in Cedarwood in southern Pueblo County. Reports of hail up to 1-inch were also made following a severe-warned thunderstorm in Pritchett in Baca County.
Flooding was not reported on any burn scars yesterday. For rainfall estimates in your area, check out the State Precipitation Map below.
Click Here For Map Overview
