SPM 09-15-2022: Widespread Rain

Issue Date: Thursday, September 15th, 2022
Issue Time: 11:45 AM MDT

Summary:

The eastern half of Colorado got in on Wednesday’s rain after a dry Tuesday. A shortwave trough emanating from the Four Corners, along with divergence from an upper-level jet streak and much-above-normal precipitable water values, combined to produce widespread showers and storms across the entirety of the state. Rainfall rates were generally light to moderate, although a few pockets of heavier rates were observed at times.

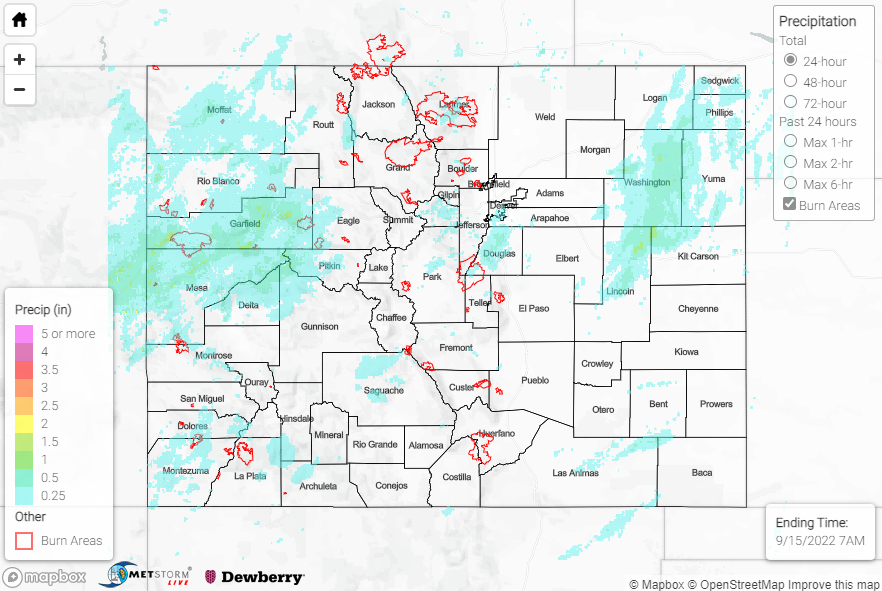
Per QPE data, the heaviest rain fell along the I-70 corridor west of the Divide, particularly in the vicinity of the Grand Valley, where amounts of 1.00-2.00” are suggested. These estimates are confirmed by gauge observations, including the following:

• 1.99” and 1.10” near Glenwood Springs
• 1.45”, 1.41”, and 1.31” west, north, and northeast of Grand Junction, respectively
• 1.32” near Mesa
• 1.03” near Badger Wash
• 0.99” near Battlement Mesa
• 0.97” near Rifle

A Flash Flood Warning was issued for the Grizzly Creek burn scar, but no flooding reports were received. Elsewhere west of the Divide (Northwest/Southwest Slopes, Central/Northern Mountains, San Juan Mountains) amounts were lighter, generally 0.25-0.75”; similar amounts were observed for portions of the Front Range and Urban Corridor, including rain gauge observations of 0.77” and 0.67” south of Denver.

A secondary region of heavy rain fell across portions of the Northeast Plains and Palmer Ridge, particularly in the counties of Lincoln, Kit-Carson, Washington, and Yuma. QPE data here suggests amounts of 1.00-2.00”, although rain gauge observations are sparse and the largest totals received were:

• 0.80” near Cope
• 0.69” near both Liberty and Anton
• 0.54” near Hugo

Farther south across the Southeast Plains, lighter and more isolated amounts of up to 1.00” were observed per QPE data.

No flooding was reported yesterday. For precipitation estimates in our area, check out the map below. Remember, if you observe flooding in your area, you can use the “Report a Flood” page to make a flood report when you can safely do so.

Click Here For Map Overview

The map below shows radar-estimated, rainfall gage-adjusted Quantitative Precipitation Estimates (QPE) across Colorado. The map is updated daily during the operational season (May 1 – Sep 30) by 11AM. The following six layers are currently available: 24-hour, 48-hour and 72-hour total precipitation, as well as maximum 1-hour, 2-hour and 6-hour precipitation over the past 24 hour period (to estimate where flash flooding may have occurred). The accumulation ending time is 7AM of the date shown in the bottom right corner. Also shown optionally are vulnerable fire burn areas (post 2012), which are updated throughout the season to include new, vulnerable burn areas. The home button in the top left corner resets the map to the original zoom.

SPM 09-14-2022: Rain Returns for Western Slope

Issue Date: Wednesday, September 14th, 2022
Issue Time: 11:45 AM MDT

Summary:

Rain returned for most of the western slope on Tuesday, as the remnants of Tropical Storm Kay made their way into the region. Precipitable water was above average and plentiful, and a series of upper-level disturbances combined to produce appreciable rainfall west of the Divide. East of the Divide, dry low-level air was entrenched and prevented any precipitation.

The heaviest rainfall was observed from the Grand Valley south-southeastward across the Southwest Slope and into the southern San Juans where amounts of 0.25-0.75” were common. Notable rainfall totals, including locally higher amounts than 0.75”, include:

• 0.85” near both Rico and west of Durango
• 0.76” near both Montrose and Big Bear Park
• 0.67” near both Hesperus and Rico
• 0.55” east of Durango

Farther north across the Northwest Slope, rainfall amounts were lighter with generally 0.25” or less.

No flooding was reported yesterday. For precipitation estimates in our area, check out the map below. Remember, if you observe flooding in your area, you can use the “Report a Flood” page to make a flood report when you can safely do so.

Click Here For Map Overview

The map below shows radar-estimated, rainfall gage-adjusted Quantitative Precipitation Estimates (QPE) across Colorado. The map is updated daily during the operational season (May 1 – Sep 30) by 11AM. The following six layers are currently available: 24-hour, 48-hour and 72-hour total precipitation, as well as maximum 1-hour, 2-hour and 6-hour precipitation over the past 24 hour period (to estimate where flash flooding may have occurred). The accumulation ending time is 7AM of the date shown in the bottom right corner. Also shown optionally are vulnerable fire burn areas (post 2012), which are updated throughout the season to include new, vulnerable burn areas. The home button in the top left corner resets the map to the original zoom.

SPM 09-13-2022: More Rain for Southern San Juans, Warm and Dry Elsewhere

Issue Date: Tuesday, September 13th, 2022
Issue Time: 10:40 AM MDT

Summary:

Above normal temperatures and dry conditions dominated the majority of the state on Monday thanks to the strong upper-level ridge in the region. Like a broken record, the exception of the day was across the southern San Juans Mountains where isolated showers and storms produced rainfall amounts of up to 0.30”. Precipitable water values were not overly impressive, so there were no flooding concerns with this rainfall; the highest rain gauge observation was 0.27” northeast of Durango.

No flooding was reported yesterday. For precipitation estimates in our area, check out the map below. Remember, if you observe flooding in your area, you can use the “Report a Flood” page to make a flood report when you can safely do so.

Click Here For Map Overview

The map below shows radar-estimated, rainfall gage-adjusted Quantitative Precipitation Estimates (QPE) across Colorado. The map is updated daily during the operational season (May 1 – Sep 30) by 11AM. The following six layers are currently available: 24-hour, 48-hour and 72-hour total precipitation, as well as maximum 1-hour, 2-hour and 6-hour precipitation over the past 24 hour period (to estimate where flash flooding may have occurred). The accumulation ending time is 7AM of the date shown in the bottom right corner. Also shown optionally are vulnerable fire burn areas (post 2012), which are updated throughout the season to include new, vulnerable burn areas. The home button in the top left corner resets the map to the original zoom.

SPM 09-12-2022: Rain for Southern San Juans, Pleasant and Dry Elsewhere

Issue Date: Monday, September 12th, 2022
Issue Time: 10:30 AM MDT

Summary:

Sunshine and warmer temperatures greeted the state yesterday, although early Sunday morning saw some of the coldest temperatures of the early fall with several mountain locations experiencing their first freeze. Dense fog was prevalent in the morning across the eastern half of the state before mixing out by late morning, while the western half of the state experienced smokey/hazy conditions throughout the day from western wildfires.

The majority of Colorado was precipitation-free, save for the southern San Juan Mountains where rainfall amounts up to 0.50” were observed. Notable rain gauge observations include 0.44” and 0.39” at automated stations east of Cortez and southeast of Durango, respectively. 0.75” hail was also reported near Vallecito.

No flooding was reported yesterday. For precipitation estimates in our area, check out the map below. Remember, if you observe flooding in your area, you can use the “Report a Flood” page to make a flood report when you can safely do so.

Click Here For Map Overview

The map below shows radar-estimated, rainfall gage-adjusted Quantitative Precipitation Estimates (QPE) across Colorado. The map is updated daily during the operational season (May 1 – Sep 30) by 11AM. The following six layers are currently available: 24-hour, 48-hour and 72-hour total precipitation, as well as maximum 1-hour, 2-hour and 6-hour precipitation over the past 24 hour period (to estimate where flash flooding may have occurred). The accumulation ending time is 7AM of the date shown in the bottom right corner. Also shown optionally are vulnerable fire burn areas (post 2012), which are updated throughout the season to include new, vulnerable burn areas. The home button in the top left corner resets the map to the original zoom.