SPM 06-23-2022: Southern Showers Across the State

Issue Date: Thursday, June 23rd, 2022
Issue Time: 10:00 AM MDT

Summary:

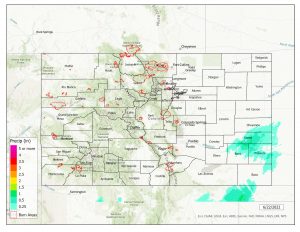
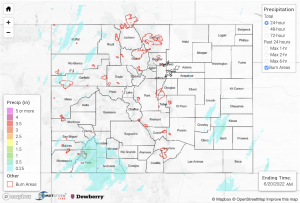
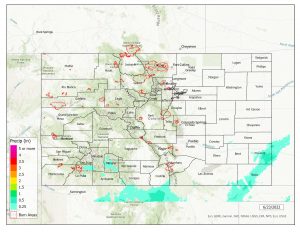
While unfortunately there was no precipitation in the northern half of the state, there was a healthy amount of rainfall in the southern half. The Southwest Slope to San Luis Valley received the bulk of the rainfall- storms consisted at first of intermittent showers beginning in the mid-late afternoon and grew steadier later into the evening. Precipitation totals throughout the southwest quadrant of the state ranged from a few hundredths of an inch, up to 0.49” in Vallecito and 0.48” near Pagosa Springs. Moving east, the Southeast Mountains and Southeast Plains also received some rainfall, with precipitation observations for this region ranging from trace amounts to 0.21”. Similarly to the west, there were CoCoRaHS remarks of intermittent showers until late afternoon. In general, things were calm aside from the rain and no severe weather was reported in Colorado yesterday.

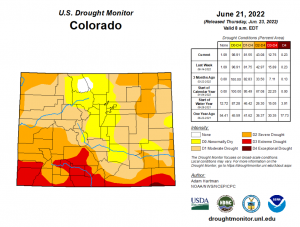
As usual for Thursdays, the updated Drought Monitor report has been issued for this week. There was little change overall- the largest difference was in the Extreme Drought condition category with a reduction in coverage from 15.89% to 12.76%. The categories of No Drought, Abnormally Dry, and Exceptional Drought all stayed the same, while Moderate and Severe Drought categories changed +/- less than 1%. The map for this week should look quite the same as last week!

There was no flooding reported yesterday. For precipitation estimates in your area, check out the map below.

Note: Grand Junction and Pueblo radars are down for maintenance. This will impact the accuracy of QPE, especially in the southwestern and southeastern portions of the state.
Click Here For Map Overview

The map below shows radar-estimated, rainfall gage-adjusted Quantitative Precipitation Estimates (QPE) across Colorado. The map is updated daily during the operational season (May 1 – Sep 30) by 11AM. The following six layers are currently available: 24-hour, 48-hour and 72-hour total precipitation, as well as maximum 1-hour, 2-hour and 6-hour precipitation over the past 24 hour period (to estimate where flash flooding may have occurred). The accumulation ending time is 7AM of the date shown in the bottom right corner. Also shown optionally are vulnerable fire burn areas (post 2012), which are updated throughout the season to include new, vulnerable burn areas. The home button in the top left corner resets the map to the original zoom.

SPM 06-22-2022: Dry and Cool, Some Showers for the Southeast

Issue Date: Wednesday, June 22nd, 2022
Issue Time: 11:55 AM MDT

Summary:

Yesterday was similar to Monday, with some rainfall present in the Southern Plains and not much elsewhere. It was also the summer solstice! This is the longest day of the year and first official day of summer- although it may not have felt like it with the cooler temperatures.

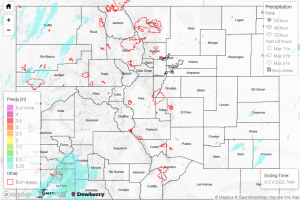
Precipitation totals were generally in the range of 0.10”-0.46”, and most rainfall was observed in our easternmost counties near the borders of Kansas and New Mexico. No thunderstorm or severe weather warnings were issued.

As mentioned before, most of the state was dry- trace to a few hundredths of an inch amounts were observed very sparingly in the Southwest Slope and San Juan Mountains- trace near Pagosa Springs, 0.01” near La Plata, 0.02″ near Durango- but that was about it for precipitation outside the southeast.

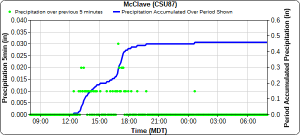
The hyetograph below from McClave, Colorado on the Southeast Plains shows long-duration, low-intensity precipitation starting early yesterday afternoon lasting into the evening, associated with a plume of subtropical moisture. Several CoCoRaHS remarks in the same area observed less, but similar, totals that also reflect the nature of the precipitation, with reports of mist and sprinkles lasting most of the day.

There was no flooding reported yesterday. For precipitation estimates in your area, check out the map below.

Note: Grand Junction and Pueblo radars are down for maintenance. This will impact the accuracy of QPE, especially in the southwestern and southeastern portions of the state.
Click Here For Map Overview

The map below shows radar-estimated, rainfall gage-adjusted Quantitative Precipitation Estimates (QPE) across Colorado. The map is updated daily during the operational season (May 1 – Sep 30) by 11AM. The following six layers are currently available: 24-hour, 48-hour and 72-hour total precipitation, as well as maximum 1-hour, 2-hour and 6-hour precipitation over the past 24 hour period (to estimate where flash flooding may have occurred). The accumulation ending time is 7AM of the date shown in the bottom right corner. Also shown optionally are vulnerable fire burn areas (post 2012), which are updated throughout the season to include new, vulnerable burn areas. The home button in the top left corner resets the map to the original zoom.

SPM 06-21-2022: Storms for the Southern Plains

Issue Date: Tuesday, June 21st, 2022
Issue Time: 9:30 AM MDT

Summary:

It was another calmer day in Colorado, with only a small amount of precipitation that was generally contained to the Southern and Central Plains in the east. Throughout the late afternoon and evening, weather reports grew a bit more interesting as storms moved through the area- 50 to 55 mph winds were observed east of Granada, along with 0.25-0.5” hail, according a CoCoRaHS reporter in Kit Carson and an NWS update.

What little rainfall did occur in Colorado was associated with those aforementioned storms in the eastern plains; totals for the day generally ranged from T-0.06” throughout the southeast corner of the state. The highest observation for the day was 0.14” of rainfall north of Lamar. For the rest of the state it was a dry day, with no precipitation observed west of the Front Range.

From both USGS and NWS sources, river flows and streamflow levels are reading normal or below normal levels for this time of the year, with none close to flood stage at this time.

There was no flooding reported yesterday. For precipitation estimates in your area, check out the map below.

Click Here For Map Overview

The map below shows radar-estimated, rainfall gage-adjusted Quantitative Precipitation Estimates (QPE) across Colorado. The map is updated daily during the operational season (May 1 – Sep 30) by 11AM. The following six layers are currently available: 24-hour, 48-hour and 72-hour total precipitation, as well as maximum 1-hour, 2-hour and 6-hour precipitation over the past 24 hour period (to estimate where flash flooding may have occurred). The accumulation ending time is 7AM of the date shown in the bottom right corner. Also shown optionally are vulnerable fire burn areas (post 2012), which are updated throughout the season to include new, vulnerable burn areas. The home button in the top left corner resets the map to the original zoom.

SPM 06-20-2022: Last Day Of Heavy Rainfall & Severe Storms For Western Colorado

Issue Date: Monday, June 20th, 2022
Issue Time: 11:25 AM MDT

Summary:

It was another active day over western Colorado and the mountains yesterday with the subtropical moisture plume pushing northward. Numerous rounds of storms fired throughout the day over the mountains, favoring areas west versus east, with the San Juan Mountains again cashing in on some significant totals. Gridded QPE looks like it’s underestimating totals over this area again this morning with a handful of SNOTEL stations over the San Juan Mountains recording over an inch of rainfall. More on that below. A MesoWest station along Highway 140 near the southern border picked up 0.93 inches for the 24-hour period and had a severe thunderstorm pass overhead in the afternoon. One-hour totals at the gauge were around 0.4 inches. The severe storm, that occurred just before 3:30PM MDT, also produced large hail that was estimated between 1.5 and 2 inches in diameter. For reference, that’s about the same size as a ping pong ball to a lime! There were a couple other severe thunderstorms over the Southwest Slope during the afternoon hours that developed due to breaks in the cloud cover that produced meaningful rainfall, a lot of hail and wind gusts up to 60 mph. The storm near Mesa Verde covered the ground in up to 6 inches of hail!

Further north, over the Grand Valley, storms were more isolated and 24-hour QPE was around 0.60 inches of rainfall for the Roan Cliffs. Highest observation in the area was 0.25 inches northwest of Rifle. More wind was also reported further north due to the lack of surface moisture and a 64 mph gust was recorded outside Meeker at 2:25PM MDT.

Another area that saw significant rainfall yesterday were the southwest facing slopes of the Southeast Mountains. A CoCoRaHS station just south of the Great Sand Dunes saw another 0.50 inches of rainfall bringing its 3-day total to 1.27 inches. MRMS QPE reached up to 1.3 inches for this area yesterday. Even the San Luis Valley got in on the action again with 0.16 inches recorded in Monte Vista, 0.24 inches near La Jara and around a quarter of an inch in the interior valley near Alamosa.

Over the Front Range, a Flash Flood Warning was issued for the Cameron Peak burn area at 2:40PM MDT. Gridded QPE estimates were around or just over 0.50 inches, which seems in line with a 0.39 observation north of Estes Park. As of this morning, there was no flooding reported. As storms pushed into the adjacent eastern plains, very little rainfall was observed for the I-25 corridor (under 0.20 inches), but some higher totals up to 0.5 inches were realized over the Southeast Plains and Palmer Ridge. Highest observation was a CoCoRaHS station in western Las Animas County that recorded 0.48 inches.

Rainfall Recap:

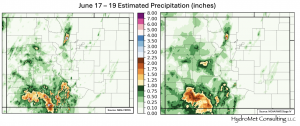
As mentioned in the previous SPM posts, QPE has been underestimated over southwest Colorado during this last event when compared to observations. Below is the estimated precipitation from June 17 to June 19th using two other gridded data sets, MRMS (left) and Stage IV (right). MRMS estimates up to 2.5 inches of rainfall falling over pockets of the San Juan Mountains, while Stage IV has widespread totals between 2 and 2.25 inches. For comparison, you can look at the 72-hour QPE in MetStorm below. If you add in SNOTEL stations, for the 3-day rainy period, the Middle Creek and Weminuche Creek sites recorded 2.8 and 2.9 inches, respectively, showing the QPE underestimations and indicating that MRMS likely did the best of the 3 QPE data sets for this region. Here’s another example. A CoCoRaHS station near the Mineral and Archuleta county line (9 miles NNW of Pagosa Springs) recorded 2.12 inches for the duration of the event. The gridded QPE shows only 1.36 inches for MRMS and 1 inch for Stage IV.

If I’ve convinced you that MRMS is the superior data set for estimating rainfall during this last event, think again! It looks like MRMS missed the higher rainfall totals over the north-central Gunnison County that occurred over the West Elk Mountains. The SNOTEL sites in the area, Schofield Pass and Upper Taylor, recorded 1.4 and 1.6 inches (respectively) for the 3-day period. The takeaway from all of this? No one gridded QPE data set is perfect, which is why the SPM tracks rainfall observations whenever it’s possible. Followers of the SPM in more rural areas, please sign up for CoCoRaHS!

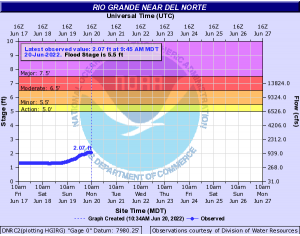
With all this widespread rainfall over the last few days, it’s not surprising that there have been streamflow rises on rivers and streams over southwest Colorado. There has been no flooding reported on any of the major rivers, but it is likely local streams and creeks are still running high this morning. Here’s a nice downstream response to all the rainfall along the Rio Grande near Del Norte. This is quite a significant response on a major river with an estimated ~550cfs jump in flow! Expect all flows to start to drop over the next 12 hours with no more rainfall in the forecast.

As of the time of this post, there has been no flooding reported. For precipitation estimates from MetStorm over your neighborhood yesterday and over the last 72-hours, scroll down to the precipitation map below.

Click Here For Map Overview

The map below shows radar-estimated, rainfall gage-adjusted Quantitative Precipitation Estimates (QPE) across Colorado. The map is updated daily during the operational season (May 1 – Sep 30) by 11AM. The following six layers are currently available: 24-hour, 48-hour and 72-hour total precipitation, as well as maximum 1-hour, 2-hour and 6-hour precipitation over the past 24 hour period (to estimate where flash flooding may have occurred). The accumulation ending time is 7AM of the date shown in the bottom right corner. Also shown optionally are vulnerable fire burn areas (post 2012), which are updated throughout the season to include new, vulnerable burn areas. The home button in the top left corner resets the map to the original zoom.