Issue Date: Thursday, June 23rd, 2022
Issue Time: 10:00 AM MDT
Summary:
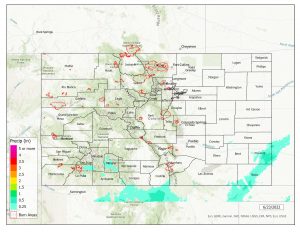
While unfortunately there was no precipitation in the northern half of the state, there was a healthy amount of rainfall in the southern half. The Southwest Slope to San Luis Valley received the bulk of the rainfall- storms consisted at first of intermittent showers beginning in the mid-late afternoon and grew steadier later into the evening. Precipitation totals throughout the southwest quadrant of the state ranged from a few hundredths of an inch, up to 0.49” in Vallecito and 0.48” near Pagosa Springs. Moving east, the Southeast Mountains and Southeast Plains also received some rainfall, with precipitation observations for this region ranging from trace amounts to 0.21”. Similarly to the west, there were CoCoRaHS remarks of intermittent showers until late afternoon. In general, things were calm aside from the rain and no severe weather was reported in Colorado yesterday.
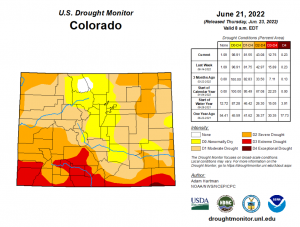
As usual for Thursdays, the updated Drought Monitor report has been issued for this week. There was little change overall- the largest difference was in the Extreme Drought condition category with a reduction in coverage from 15.89% to 12.76%. The categories of No Drought, Abnormally Dry, and Exceptional Drought all stayed the same, while Moderate and Severe Drought categories changed +/- less than 1%. The map for this week should look quite the same as last week!
There was no flooding reported yesterday. For precipitation estimates in your area, check out the map below.
Note: Grand Junction and Pueblo radars are down for maintenance. This will impact the accuracy of QPE, especially in the southwestern and southeastern portions of the state.

