SPM 09-05-2017: Heat and Haze with Isolated Showers

Issue Date: Tuesday, September 5, 2017
Issue Time: 10:30AM MDT

Summary:

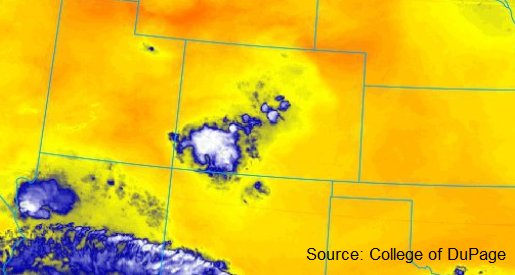
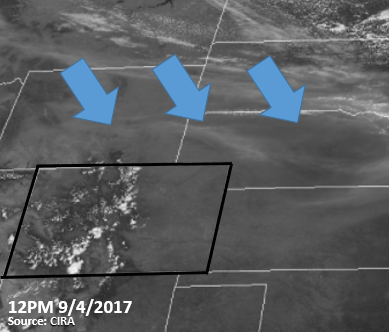
The most notable weather feature yesterday was the lack of visibility. Ongoing fires in Montana, western South Dakota and Idaho continue to produce massive plumes of smoke. With the High pressure centered just west of Colorado, the smoke particles were advected clockwise around the High and into the state. During the peak of the day, visibility was limited to 3-4 miles around Denver and was less than 2 miles over portions of the eastern plains. West of the divide, visibility in the north was in the 2-3 mile range. A visible satellite image from the GOES-16 from 12PM is below. Other than in the Grand Valley, high temperatures yesterday were reduced by 5-10F across the state. The passage of a cold front over the eastern plains helped thin some of the haze and enrich low-level moisture for afternoon shower over the Palmer Ridge. The front was too shallow to alleviate smoke and temperatures west of the Continental Divide.

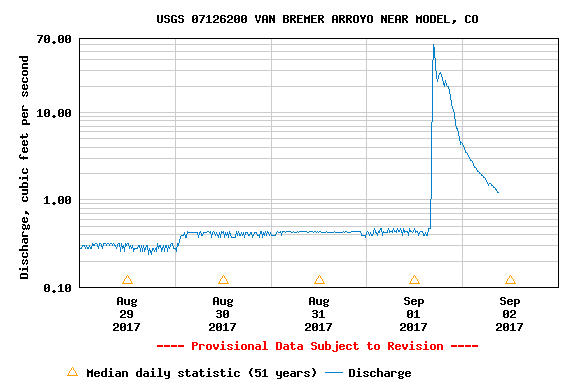
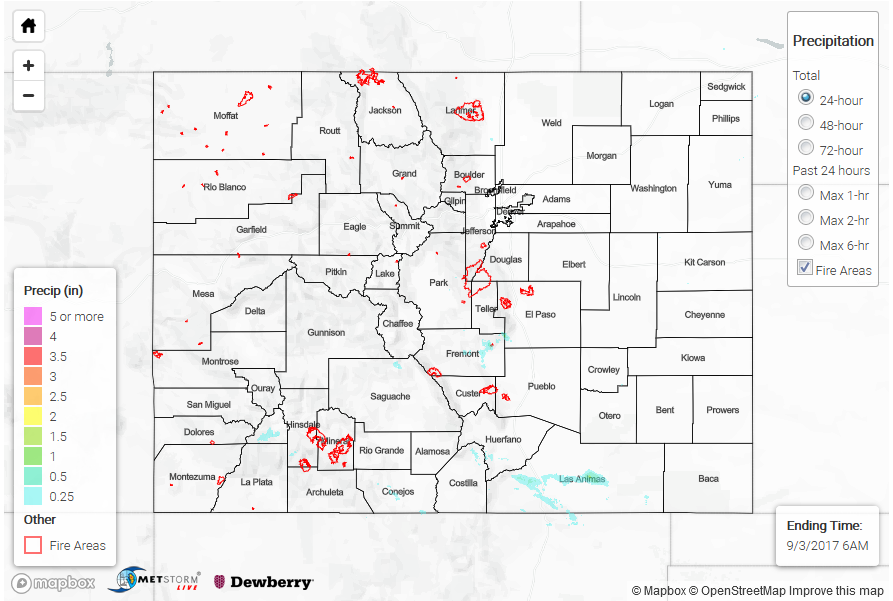
Showers yesterday were confined to the southern high terrain and Palmer Ridge. While showers also attempted to form over the Front Range, only trace amounts of rainfall reached the surface. With low moisture, storm totals were not very high. Over Las Animas County, a CoCoRaHS station recorded 0.23 inches of rain. In the San Juan Mountains, a SNOTEL station recorded 0.4 inches. The highest estimates of rainfall by radar were over Elbert County where 0.5 inches were estimated to have fallen along the Palmer Ridge with the passage of the cold front.

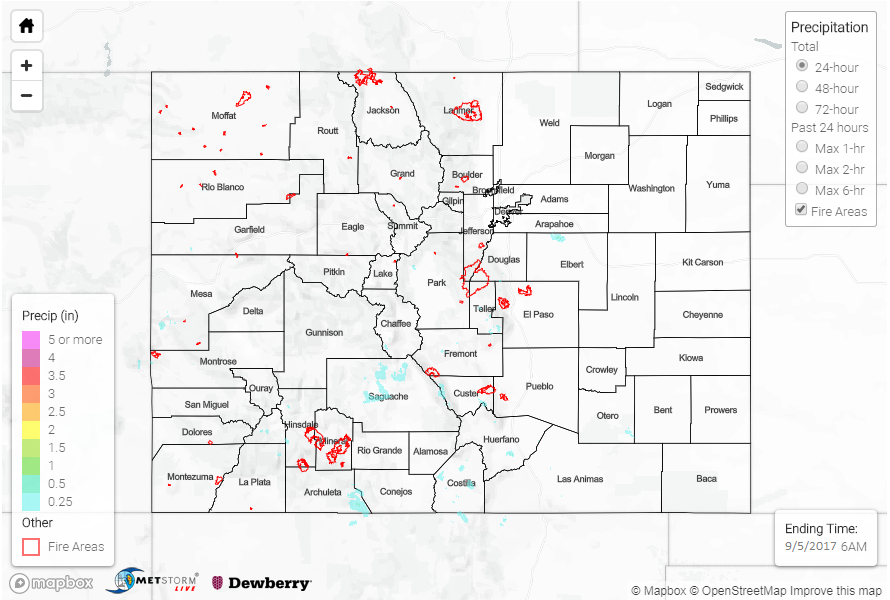
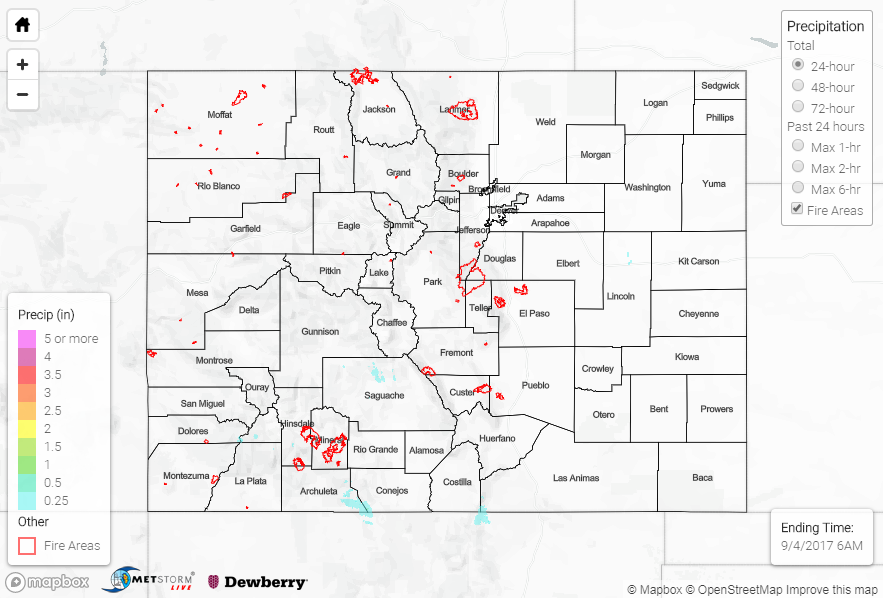
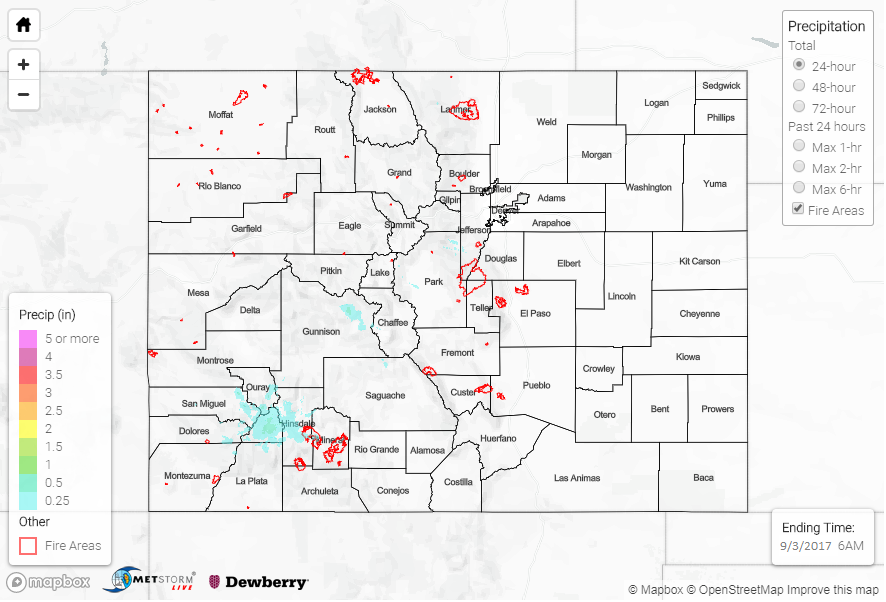
Flooding was not reported on Monday. To see where rain fell over the state, scroll down to the State Precipitation Map below.

Click Here For Map Overview

The map below shows radar-estimated, rainfall gage-adjusted Quantitative Precipitation Estimates (QPE) across Colorado. The map is updated daily during the operational season (May 1 – Sep 30) by 11AM. The following six layers are currently available: 24-hour, 48-hour and 72-hour total precipitation, as well as maximum 1-hour, 2-hour and 6-hour precipitation over the past 24 hour period (to estimate where flash flooding may have occurred). The accumulation ending time is 6AM of the date shown in the bottom right corner. Also shown optionally are fire burn areas since 2012. The home button in the top left corner resets the map to the original zoom.

Note: We have identified a possible underestimation in QPE over the southwest part of the state. We are working to on this issue, and will provide an update as soon as possible.

SPM 09-04-2017: Heat and Smoke Continued with Light Showers over the Southwest High Country

Issue Date: Monday, September 4, 2017
Issue Time: 09:45AM MDT

Summary:

The persistent high pressure to the west continued the heat wave yesterday. High temperatures over the eastern plains were in the mid to upper 90s with a few places reaching 100F. Temperatures also reached the upper 90s over the Grand Valley. In the mountains, highs generally continued to run 5-10F above climatology. Smoke remained over northern Colorado and portions of the eastern plains yesterday from the ongoing fires in Idaho and Montana. The smoke was advected into the state as it circulated around the high pressure system and limited visibility in these regions.

Another quiet day for rainfall as anticipated. A few storms over the Front Range produced totals under 0.1 inches. The strongest showers occurred over the San Juan Mountains and Southwest Slopes, but, again, not much rain was generated from these storms. A CoCoRaHS station in San Miguel County reported 0.13 inches, while SNOTEL sites over the San Juans recorded values around 0.2 inches. Radar estimates were as high as 0.5 inches.

Flooding was not reported on Sunday. To see how much rain fell in your area, scroll down and check out the State Precipitation Map below.

Click Here For Map Overview

The map below shows radar-estimated, rainfall gage-adjusted Quantitative Precipitation Estimates (QPE) across Colorado. The map is updated daily during the operational season (May 1 – Sep 30) by 11AM. The following six layers are currently available: 24-hour, 48-hour and 72-hour total precipitation, as well as maximum 1-hour, 2-hour and 6-hour precipitation over the past 24 hour period (to estimate where flash flooding may have occurred). The accumulation ending time is 6AM of the date shown in the bottom right corner. Also shown optionally are fire burn areas since 2012. The home button in the top left corner resets the map to the original zoom.

Note: We have identified a possible underestimation in QPE over the southwest part of the state. We are working to on this issue, and will provide an update as soon as possible.

SPM 09-03-2017: Heat Builds, But A Few Storms Persist In Favored Regions

Issue Date: Sunday, September 3, 2017
Issue Time: 9:15AM MDT

Summary:

The first day of intense heat from the Labor Day Weekend heat wave is in the books as a high pressure ridge allowed for plenty of sunshine (for most) on Saturday. The end result was temperatures 5-10F above normal statewide. High temperatures in the mid-90s F were common across southeast and western Colorado. Interestingly, in the northeast part of the state, despite plenty of sunshine, temperatures were likely limited by the thick haze from the numerous wildfires burning to our northwest.

Nonetheless, despite seemingly low odds because of marginal moisture, isolated to widely scattered storms managed to form in the Central Mountains, southern Front Range, San Juans and Southeast Mountains. This is an excellent example of how high elevation terrain can drive its own circulation. As expected, storms had a difficult time producing rainfall and the highest totals this morning were a few tenths of an inch. Interestingly, it appears that a storms combined to form a localized circulation over the San Juans that kept producing light rain showers after sunset (see Saturday evening’s water vapor image, below).

Flooding was not reported on Saturday. For rainfall estimates in your area, check out our State Precipitation Map below.

Click Here For Map Overview

The map below shows radar-estimated, rainfall gage-adjusted Quantitative Precipitation Estimates (QPE) across Colorado. The map is updated daily during the operational season (May 1 – Sep 30) by 11AM. The following six layers are currently available: 24-hour, 48-hour and 72-hour total precipitation, as well as maximum 1-hour, 2-hour and 6-hour precipitation over the past 24 hour period (to estimate where flash flooding may have occurred). The accumulation ending time is 6AM of the date shown in the bottom right corner. Also shown optionally are fire burn areas since 2012. The home button in the top left corner resets the map to the original zoom.

Note: We have identified a possible underestimation in QPE over the southwest part of the state. We are working to on this issue, and will provide an update as soon as possible.

SPM 09-02-2017: Disturbance Clears Colorado, Produces Mostly Clouds With A Few Heavy “Rainers”

Issue Date: Saturday, September 2, 2017
Issue Time: 9:48AM MDT

Summary:

A disturbance trekked quickly across Colorado on Friday, produces a lot of clouds but only limited rainfall. Most of the rainfall occurred in the form of thunderstorms, focused over the climatologically favored Southeast Mountains, Raton Ridge and San Juan Mountains. Storms made the most of the marginal moisture and a few produced rainfall rates up to about 1.2 inches per hour over Las Animas County and up to 0.7 inches per hour over Conejos County. In Las Animas County, the heavy rainfall fell in close proximity to a few USGS gages and a quick streamflow spike from less than 1 c.f.s. to 60 c.f.s. was noted on the Van Bremer arroyo (see below).

The disturbance also knocked down the afternoon high temperatures closer to seasonal normal west of the Continental Divide. Though, as described in today’s Flood Threat Bulletin, this respite was only temporary.

Flooding was not reported on Friday. For rainfall estimates in your area, check out our State Precipitation Map below.

Click Here For Map Overview

The map below shows radar-estimated, rainfall gage-adjusted Quantitative Precipitation Estimates (QPE) across Colorado. The map is updated daily during the operational season (May 1 – Sep 30) by 11AM. The following six layers are currently available: 24-hour, 48-hour and 72-hour total precipitation, as well as maximum 1-hour, 2-hour and 6-hour precipitation over the past 24 hour period (to estimate where flash flooding may have occurred). The accumulation ending time is 6AM of the date shown in the bottom right corner. Also shown optionally are fire burn areas since 2012. The home button in the top left corner resets the map to the original zoom.

Note: We have identified a possible underestimation in QPE over the southwest part of the state. We are working to on this issue, and will provide an update as soon as possible.