SPM 05-07-2018: Evening Cloud Cover and an Isolated Thunderstorm over Weld County

Issue Date: Monday, May 7, 2018
Issue Time: 9:00AM MDT

Summary:

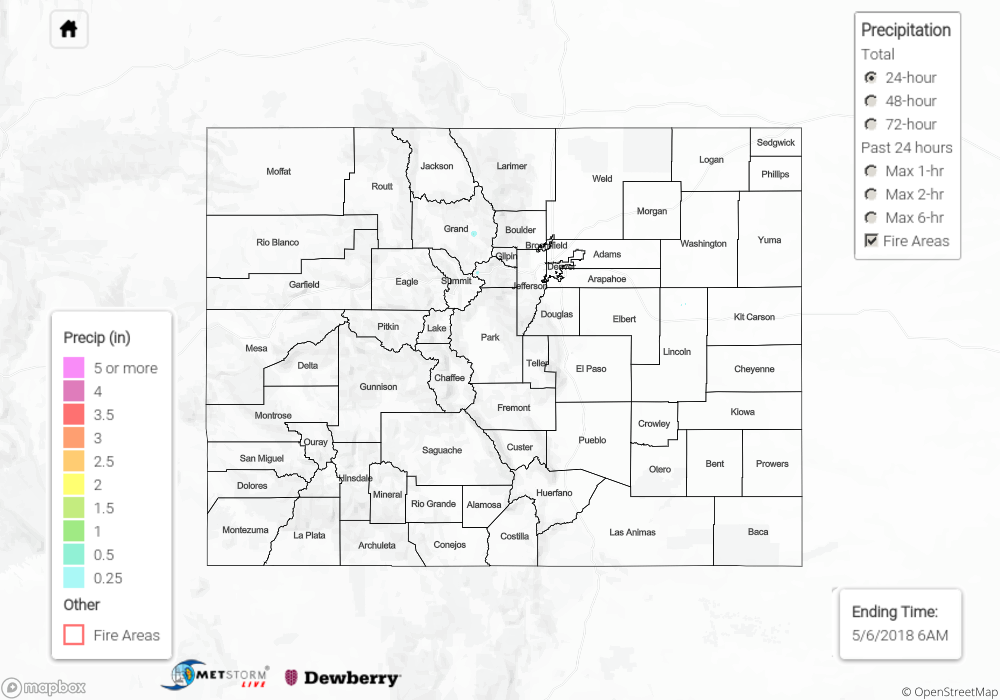
Mostly clear skies for the majority of the day lead to high temperatures in the mid-70s for the lower elevations, while isolated locations in the mountains reached 60F. As the upper disturbance began approaching the state from the west, widespread mid and high level cloud cover was present by early evening. However, with low moisture, only minimal rainfall was reported over the mountains with totals up to 0.1 inches. Over Weld County, the weak shortwave, minimal CAPE and isolated moisture combined to form a secluded thunderstorm. Spotters reported small hail (penny size) and, due to low moisture, gusts of 25 mph were recorded at nearby airports.  Radar estimates were up to 0.5 inches with a MesoWest station in Atwood reporting 0.5 inches.

There was no flooding reported Sunday. For an estimate of rainfall totals in your area, scroll down to the State Precipitation Map below.

Click Here For Map Overview

The map below shows radar-estimated, rainfall gage-adjusted Quantitative Precipitation Estimates (QPE) across Colorado. The map is updated daily during the operational season (May 1 – Sep 30) by 11AM. The following six layers are currently available: 24-hour, 48-hour and 72-hour total precipitation, as well as maximum 1-hour, 2-hour and 6-hour precipitation over the past 24 hour period (to estimate where flash flooding may have occurred). The accumulation ending time is 6AM of the date shown in the bottom right corner. Also shown optionally are fire burn areas since 2012. The home button in the top left corner resets the map to the original zoom.

Note: We have identified a possible underestimation in QPE over the southwest part of the state. We are working to on this issue, and will provide an update as soon as possible.

SPM 05-06-2018: Warmer and Drier, Only a Couple High-Based Sprinkles

Issue Date: Sunday, May 6th, 2018
Issue Time: 9:30 AM MDT

Summary:

High pressure remained in charge of Colorado weather yesterday, allowing temperatures to climb higher than the previous day. The vast majority of the state remained dry and underneath mostly sunny skies. However, during the late afternoon and early evening hours, cumulus clouds bubbled and a few high-based showers developed over the High Country, producing plenty of virga and a few brief bouts with sprinkles. A couple of these high-based showers drifted over adjacent low elevations, producing nothing more than gusty winds and virga. After sunset, the loss of daytime heating effectively shut off any activity, and it was a quiet night across Colorado.

Flash flooding was not reported yesterday. For a look at precipitation estimates in your area, please see our State Precipitation Map below.

Click Here For Map Overview

The map below shows radar-estimated, rainfall gage-adjusted Quantitative Precipitation Estimates (QPE) across Colorado. The map is updated daily during the operational season (May 1 – Sep 30) by 11AM. The following six layers are currently available: 24-hour, 48-hour and 72-hour total precipitation, as well as maximum 1-hour, 2-hour and 6-hour precipitation over the past 24 hour period (to estimate where flash flooding may have occurred). The accumulation ending time is 6AM of the date shown in the bottom right corner. Also shown optionally are fire burn areas since 2012. The home button in the top left corner resets the map to the original zoom.

Note: We have identified a possible underestimation in QPE over the southwest part of the state. We are working to on this issue, and will provide an update as soon as possible.

SPM 05-05-2018: High Pressure Dominated the State with Warm and Mainly Dry Conditions

Issue Date: Saturday, May 5th, 2018
Issue Time: 9:30 AM MDT

Summary:

As upper-level ridging built across the state, moisture exited, and Colorado was left with a near-perfect end to the work week. Residual moisture remaining from the recent rains helped to generate isolated weak showers over, and immediately adjacent to, the higher terrain, resulting in nothing more than a few sprinkles and some gusty winds. If you didn’t get the chance to go outside yesterday, you should take a look at today’s FTB and get outside today.

Flash flooding was not reported yesterday. For a look at precipitation estimates in your area, please see our State Precipitation Map below.

Click Here For Map Overview

The map below shows radar-estimated, rainfall gage-adjusted Quantitative Precipitation Estimates (QPE) across Colorado. The map is updated daily during the operational season (May 1 – Sep 30) by 11AM. The following six layers are currently available: 24-hour, 48-hour and 72-hour total precipitation, as well as maximum 1-hour, 2-hour and 6-hour precipitation over the past 24 hour period (to estimate where flash flooding may have occurred). The accumulation ending time is 6AM of the date shown in the bottom right corner. Also shown optionally are fire burn areas since 2012. The home button in the top left corner resets the map to the original zoom.

Note: We have identified a possible underestimation in QPE over the southwest part of the state. We are working to on this issue, and will provide an update as soon as possible.

SPM 05-04-2018: Exiting Low Pressure Provided More Beneficial Moisture

Issue Date: Friday, May 4th, 2018
Issue Time: 9:30 AM MDT

Summary:

The exiting low-pressure system provided one more day of scattered rainfall across the state, even allowing portions of the Southeast Mountains, Raton Ridge, and Southeast Plains to pick up on some much needed, even if too little, moisture. Elsewhere, the Northeast Plains and Urban Corridor continued to be the big winners of the state, as the best moisture and upper-level support existed there. A swath of 0.5-1.0 inch of rainfall, with locally higher amounts, impacted the Urban Corridor from Denver to the WY state line.

Out west over the High Country, scattered showers/thunderstorms dotted the higher elevations and lower valleys, with snow levels meandering between 7000 and 8000 feet. Heavy snow was reported across the higher elevations, with some locations picking up on more than 6” of snow.

Flash flooding was not reported yesterday. For a look at precipitation estimates in your area, please see our State Precipitation Map below.

Click Here For Map Overview

The map below shows radar-estimated, rainfall gage-adjusted Quantitative Precipitation Estimates (QPE) across Colorado. The map is updated daily during the operational season (May 1 – Sep 30) by 11AM. The following six layers are currently available: 24-hour, 48-hour and 72-hour total precipitation, as well as maximum 1-hour, 2-hour and 6-hour precipitation over the past 24 hour period (to estimate where flash flooding may have occurred). The accumulation ending time is 6AM of the date shown in the bottom right corner. Also shown optionally are fire burn areas since 2012. The home button in the top left corner resets the map to the original zoom.

Note: We have identified a possible underestimation in QPE over the southwest part of the state. We are working to on this issue, and will provide an update as soon as possible.