Issue Date: Friday, May 11th, 2018
Issue Time: 9:30 AM MDT
Summary:
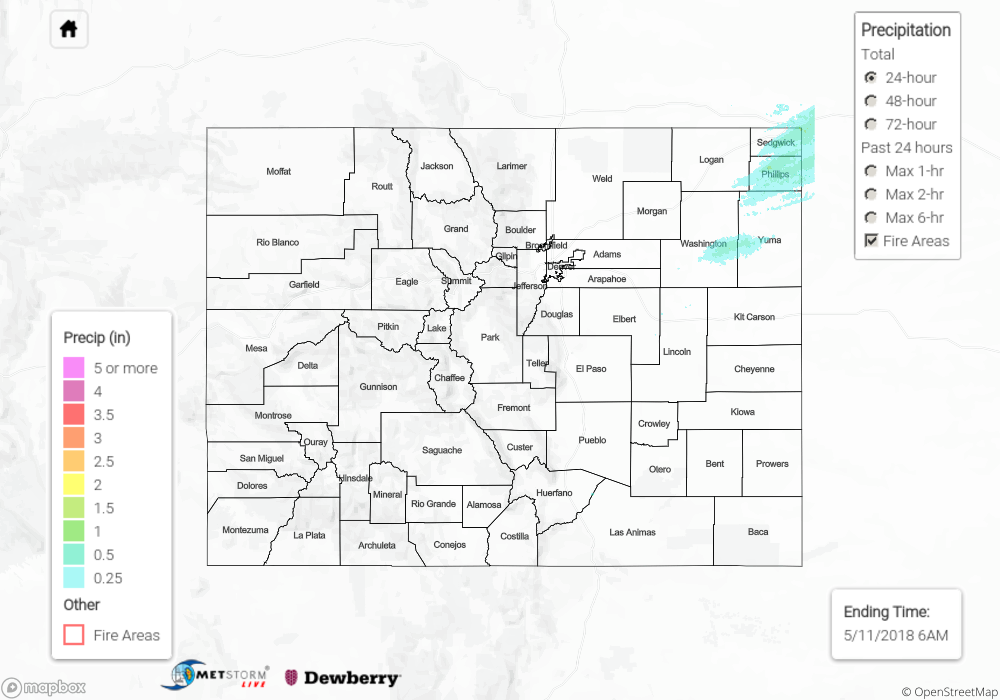
Dry and summer-like conditions could be found across much of the state, as the warming trend continued and pushed temperatures above Wednesday’s high temperatures. Offering a respite from the heat were isolated showers/thunderstorms, which dotted the state during the afternoon/evening hours, mainly along/north of I-70 where better moisture and upper-level support coincided. The strongest storms of the day rumbled across the Northeast Plains, where a few instances of severe hail were reported to the National Weather Service:
1.5 inch hail: North of Holyoke (Phillips County)
1.25 inch hail: 6 miles South of Julesburg (Sedgwick County)
1 inch hail: 6 miles SSE of Wages (Phillips County) and 1 mile SE of Holyoke (Phillips County)
A few light rain showers continued this morning across the higher terrain of the Northwest Slope, where surface moisture convergence, orographic effects, and upper-level support have kept the activity going. Overall, rainfall was light due and virga was plentiful as the near-surface moisture remained a bit on the low side, with only brief periods of moderate rainfall underneath the strong thunderstorms in northeast Colorado.
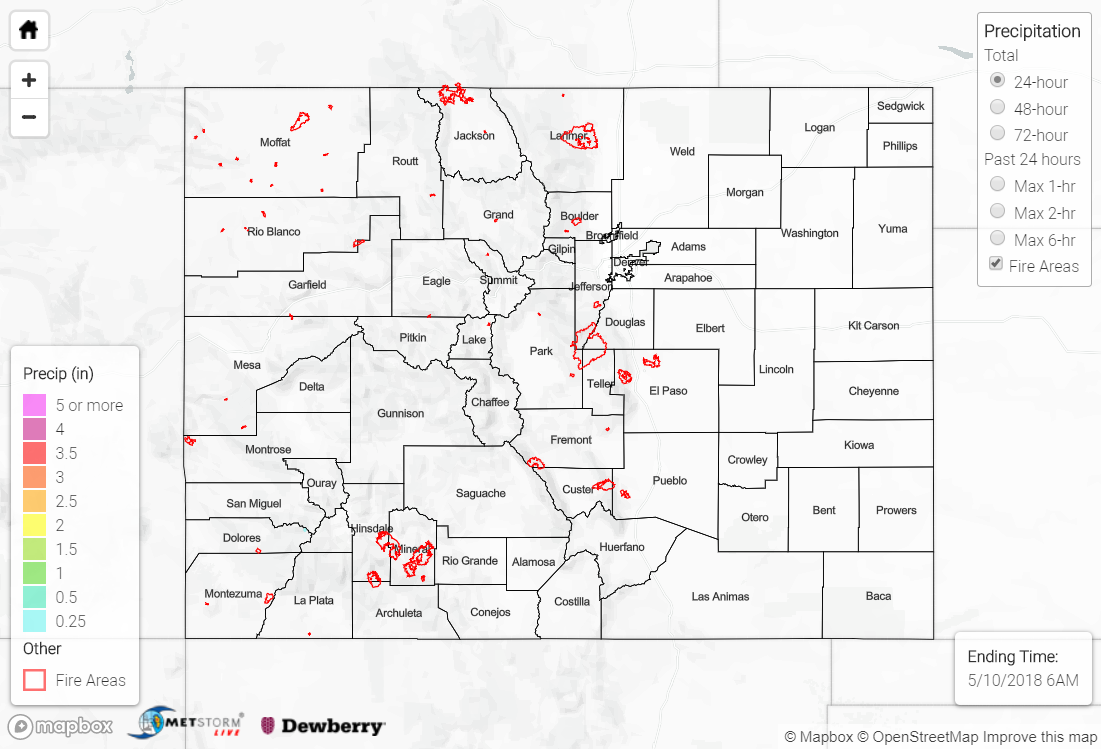
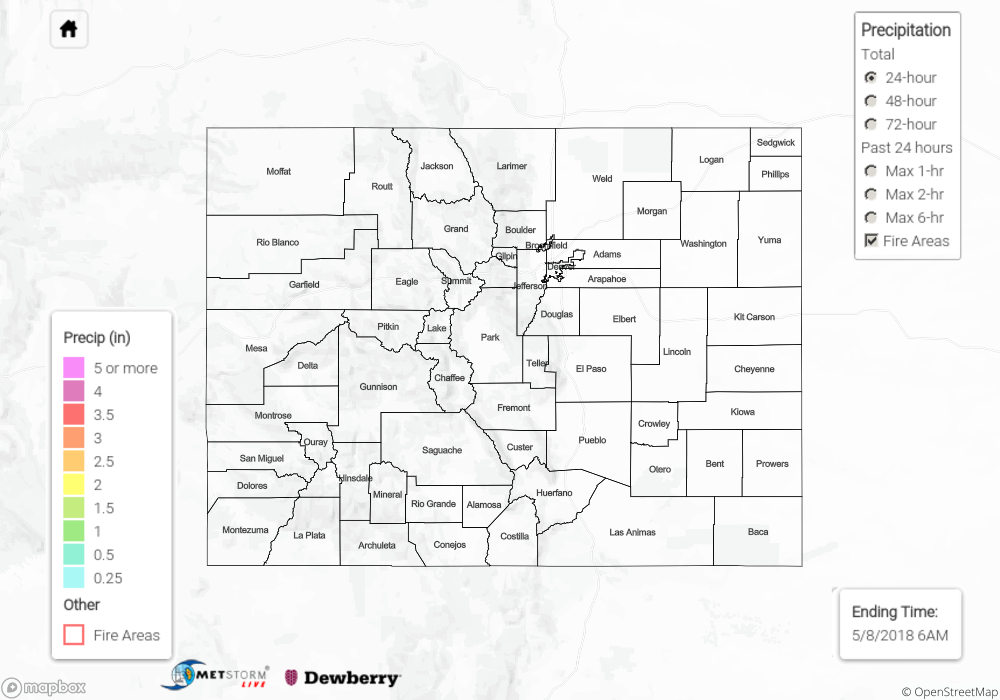
Flash flooding was not reported yesterday. For a look at precipitation estimates in your area, please see our State Precipitation Map below.
Click Here For Map Overview
Note: We have identified a possible underestimation in QPE over the southwest part of the state. We are working to on this issue, and will provide an update as soon as possible.