Issue Date: Thursday, May 10th, 2018
Issue Time: 10:00 AM MDT
Summary:
Wednesday in Colorado saw another day of mostly sunny, warm, and dry weather. Hopefully you were able to take advantage of these nice conditions, especially up in the mountains. By the afternoon, increasing cloud cover in the eastern half of the state led to the beginnings of thunderstorm activity from the Urban Corridor to the Northeast and Southeast Plains. For the most part, these thunderstorms produced the occasional high wind gust and plenty of virga draped across the early evening sky. Late in the afternoon, thunderstorms really began to pick up for the Southeast Plains. Rainfall left its mark from Kit Carson and south all the way to Las Animas and Baca counties, for the most part in less than an hour bursts of about 0.25 inches per hour, occasionally up to around 0.5 inches. One CoCoRaHS gauge in Cheyenne County recorded 0.45 inches over the course of the day Wednesday, and this was by far the most amount of rainfall recorded for any gauge in the area. Most other CoCoRaHS gauges in the Southeast Plains recorded between 0.05 and 0.25 inches. This can be seen as a testament to the sort of “popcorn” variety of storm seen over the late afternoon hours across eastern Colorado: many of them not fully developing into intense storms until they crossed the border into Kansas later on in the evening. In fact, it was these storms that brought blowing dust so intense that a couple of National Weather Service local storm reports in Kansas noted zero to a quarter mile visibility!
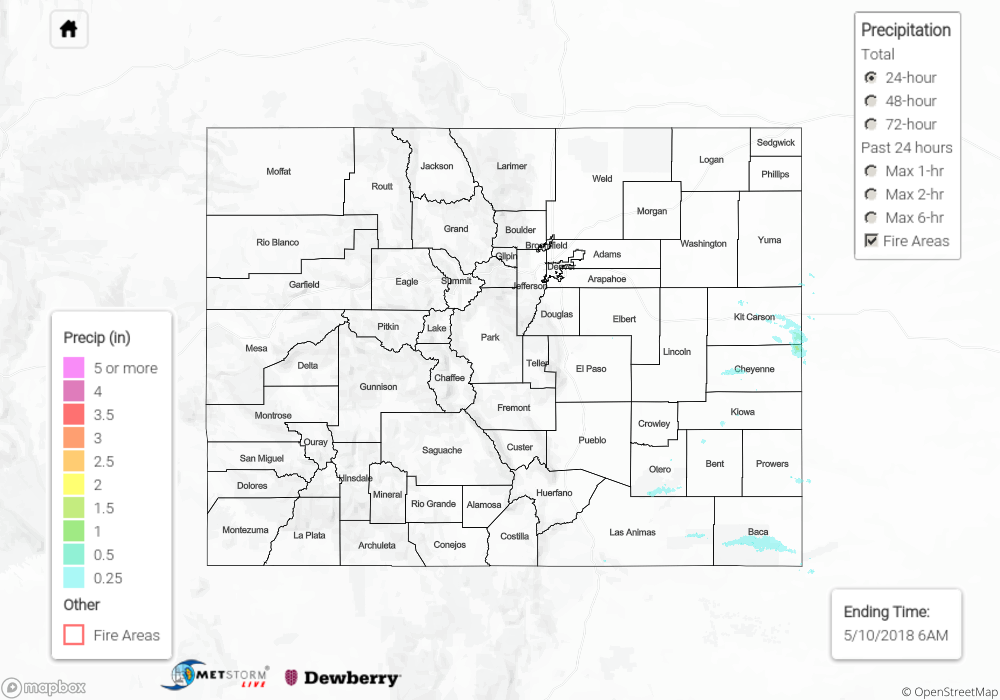
In all, no flash flooding was reported yesterday. For a look at precipitation estimates in your area, please see our State Precipitation Map below.
Click Here For Map Overview
Note: We have identified a possible underestimation in QPE over the southwest part of the state. We are working to on this issue, and will provide an update as soon as possible.