Issue Date: Tuesday, May 8, 2018
Issue Time: 9:00AM MDT
Summary:
An upper trough moved through the state Monday afternoon through Tuesday morning. This kept widespread high and mid-level cloud cover throughout the day. Despite the cloud cover, drier air and westerly flow allowed high temperatures to reach the upper 70s and low 80s over the lower elevations. Temperatures over the southeast corner of the state even reached the mid 80s. The drier air limited rainfall totals over the mountains with various locations in the mountains reporting 0.1 inches. Higher dew points over the eastern plains were quick to mix out in the afternoon and all convection remained north of Colorado.
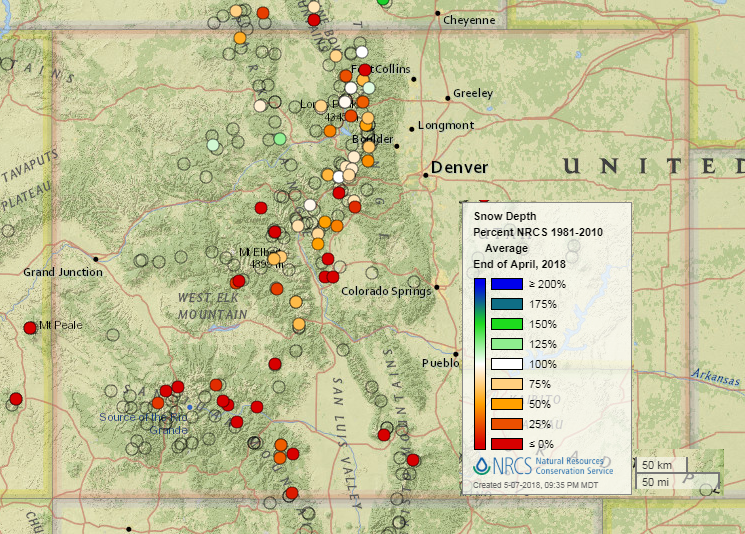
Below shows the average snow depth over Colorado for April at various SNOTEL sites when compared to average (1981-2010) from NRCS. The snowpack over the San Juan Mountains in southern Colorado is less than 25% of normal for this time of year. The high country to the north is fairing much better, but basins are still only at 85% of normal. Thankfully, reservoirs are at or above normal across the state, which will help lessen the impacts of the low snow depth. While it’s a bit early to tell what the fire season holds, rainfall this spring is imperative to help alleviate the developing drought over the southern portion of the state.
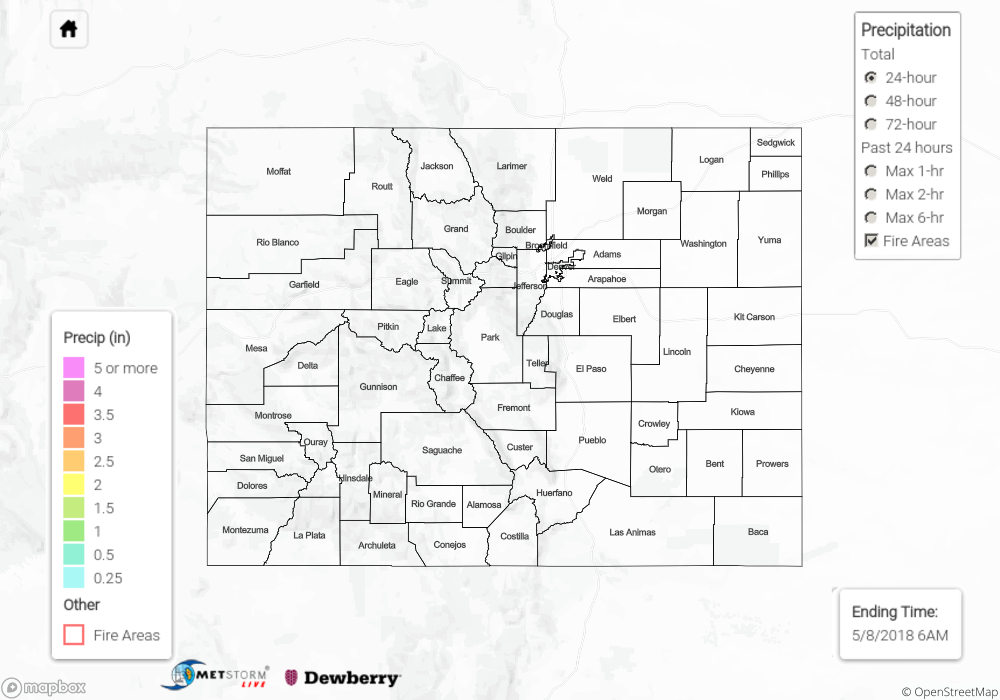
There was no flooding reported Monday. For an estimate of rainfall totals in your area, scroll down to the State Precipitation Map below.
Click Here For Map Overview
Note: We have identified a possible underestimation in QPE over the southwest part of the state. We are working to on this issue, and will provide an update as soon as possible.