SPM 05-15-2018: Impressive Hail Accompanies Thunderstorms on Monday

Issue Date: Tuesday, May 15, 2018
Issue Time: 10:15AM MDT

Summary:

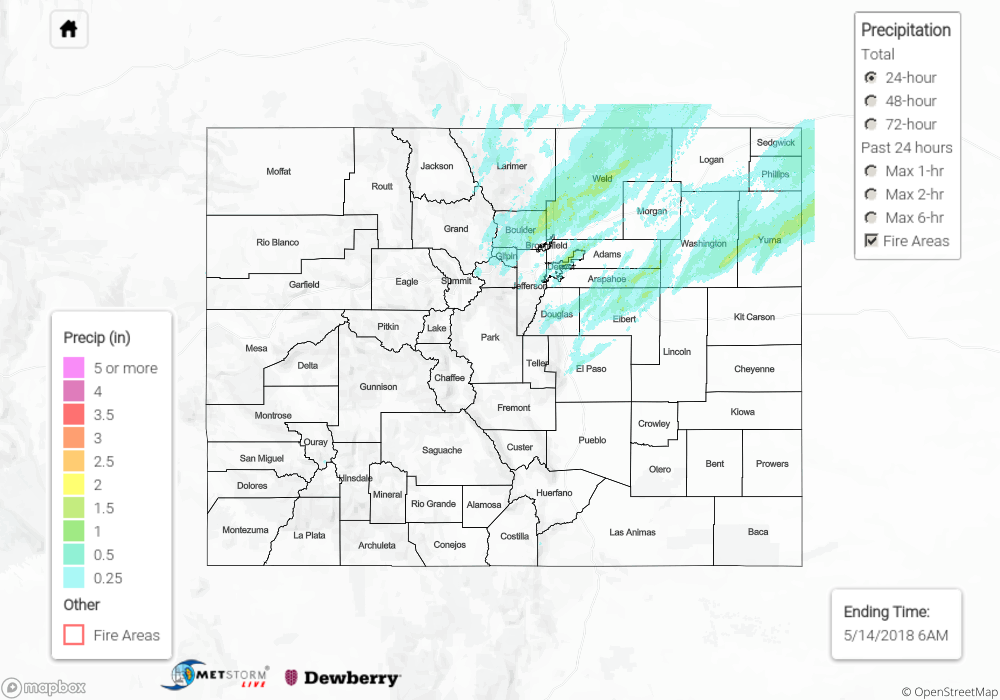
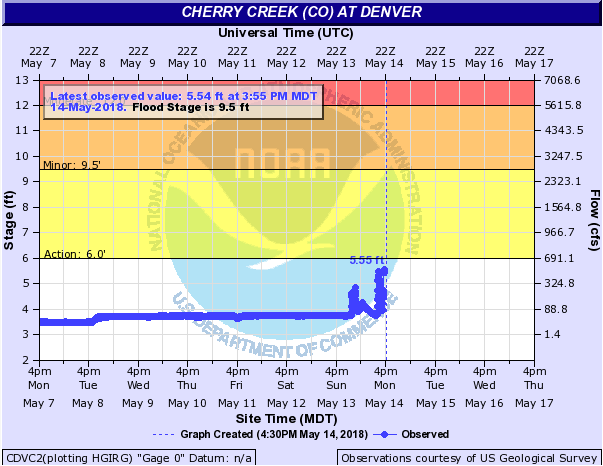
Quite an exciting start to the week for the Urban Corridor on Monday. Early morning clearing helped initiate thunderstorms along the Front Range just before 11am. The first storm moved into Denver by 11am and brought with it quite the show! Due to the low freezing levels, hail almost immediately started falling out of the core of the storm. Penny sized hail covered the ground in what looked like a layer of snow over most of the metro area and downtown Denver. This caused some minor flooding along ungagged streams, but no flooding was reported. Below is the gage from Cherry Creek, which spiked after the rainfall just under the Action stage. The UDFCD gage network max 1-hour rainfall recorded was 0.94 inches (Watkins) with up to 0.8 inches in the urban areas. Further south in Parker, a storm dropped 3 inches of penny-sized hail that completely covered the roadways near the Pinery. It was enough accumulation that they brought in plows to clear the roads! Hope those folks didn’t change out their snow tires just yet.

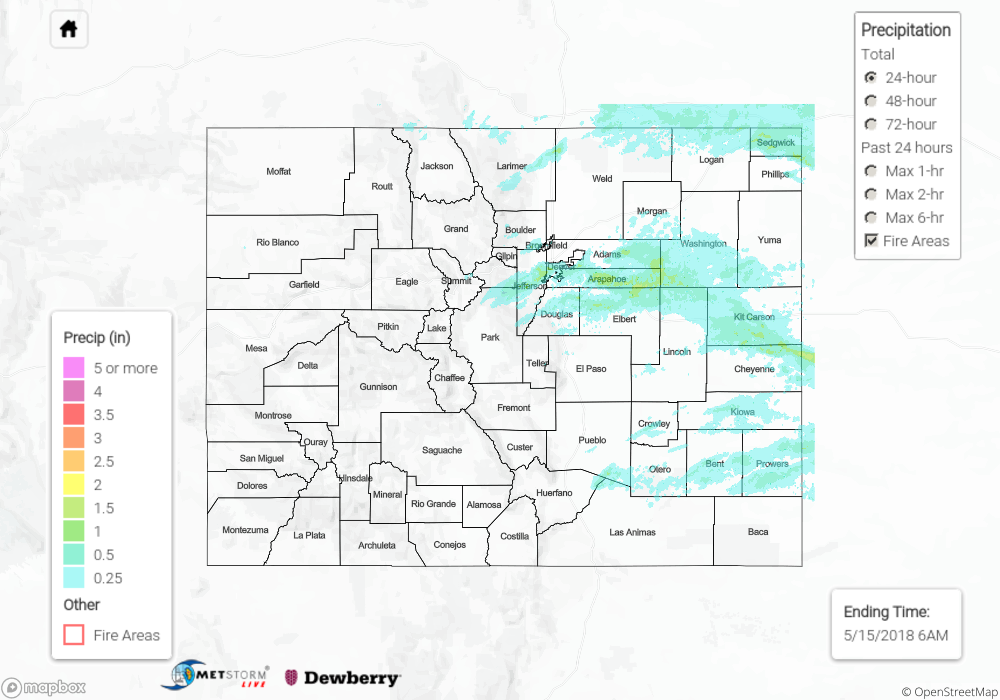
The storms continued to move to the east over the Palmer Ridge and Northeast Plains into better storm dynamics. As expected, they quickly became severe and formed a bow. A bow echo is associated with strong winds and, sure enough, a gust of 75mph was recorded in Cheyenne County. Two storm chasers reported 2.75 inch hail (baseball) in Kit Carson County, which unfortunately blew out one of their windshield. Thankfully no one was hurt. 1-hour max rainfall was estimated at 1.5 inches. A CoCoRaHS gage north of Cheyenne Wells recorded 1.35 inches. Upslope flow continued to trigger less severe thunderstorms overnight giving the Southeast Plains some much needed rainfall. Radar estimates in this area were just over 0.5 inches.

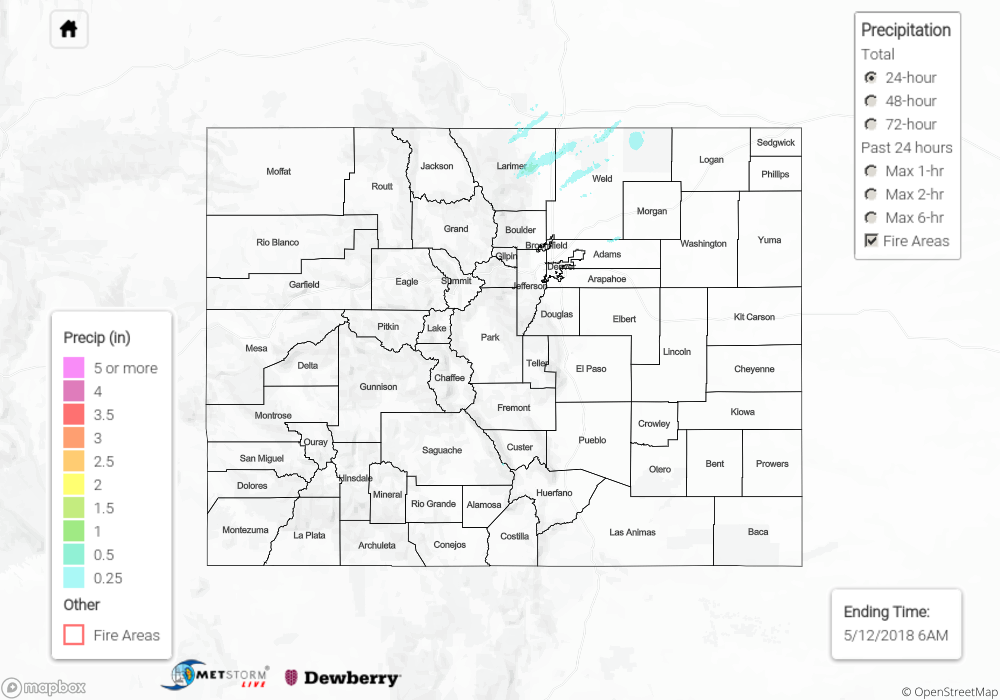
Even with large amount of hail and heavy rainfall, no flooding was reported yesterday. To see rainfall estimates in your neighborhood, scroll down to the State Precipitation Map below.

Click Here For Map Overview

The map below shows radar-estimated, rainfall gage-adjusted Quantitative Precipitation Estimates (QPE) across Colorado. The map is updated daily during the operational season (May 1 – Sep 30) by 11AM. The following six layers are currently available: 24-hour, 48-hour and 72-hour total precipitation, as well as maximum 1-hour, 2-hour and 6-hour precipitation over the past 24 hour period (to estimate where flash flooding may have occurred). The accumulation ending time is 6AM of the date shown in the bottom right corner. Also shown optionally are fire burn areas since 2012. The home button in the top left corner resets the map to the original zoom.

Note: We have identified a possible underestimation in QPE over the southwest part of the state. We are working to on this issue, and will provide an update as soon as possible.

SPM 05-14-2018: Hail Producing Thunderstorms Cause Damage to Planes at DIA

Issue Date: Monday, May 14, 2018
Issue Time: 10:30AM MDT

Summary:

Sunday was another day of cool temperatures and wet weather for the northeast portion of the state. Elsewhere in the lower elevations, it remained quiet dry with pleasant temperatures in the mid-70s and low 80s. Midday clearing and a passing upper level disturbance combined to form several thunderstorms over the Front Range and Palmer Ridge that moved into the Urban Corridor. Another set of storms formed over the Northeast Plains along a line of convergence. With low freezing levels, large hail was reported with the thunderstorms, and the storm just north of Elizabeth produced hail 1.5 inches in diameter. While not the strongest storm, the most impactful storm passed over DIA late last night and produced 0.75 inch hail. This hail caused damage to several planes, which in turn lead to cancellations this morning. Max 1-hour rain rates were estimated at 1 inch with storm totals up to 1.5 inches.

Despite the hail and heavy rainfall, no flooding was reported Sunday. For an estimate of rainfall totals in your area, scroll down to the State Precipitation Map below.

Click Here For Map Overview

The map below shows radar-estimated, rainfall gage-adjusted Quantitative Precipitation Estimates (QPE) across Colorado. The map is updated daily during the operational season (May 1 – Sep 30) by 11AM. The following six layers are currently available: 24-hour, 48-hour and 72-hour total precipitation, as well as maximum 1-hour, 2-hour and 6-hour precipitation over the past 24 hour period (to estimate where flash flooding may have occurred). The accumulation ending time is 6AM of the date shown in the bottom right corner. Also shown optionally are fire burn areas since 2012. The home button in the top left corner resets the map to the original zoom.

Note: We have identified a possible underestimation in QPE over the southwest part of the state. We are working to on this issue, and will provide an update as soon as possible.

SPM 05-13-2018: Wet Near Urban Corridor, Quiet Elsewhere

Issue Date: Sunday, May 13th, 2018
Issue Time: 10:47 AM MDT

Summary:

Yesterday was dry for many across the state, as southwest flow around the large upper-level low to the west ushered in warm, dry air to the high country and western slopes. Northeastern portions of the state began the day under fog and low stratus, with drizzle and light rain along the foothills and urban corridor producing a widespread 0.10” to 0.50” of rain (see 24-hour CoCoRaHS totals below). By midday, some lifting and clearing of the cloud layer allowed some instability to build, and this instability was tapped by a mid-level shortwave that moved through CO over the course of the evening. Two main small bands of thunderstorms were the result, with one setting up over central and northeastern Larimer County and another near Longmont. These locations were the big winners for precipitation across the state yesterday, with a few locations around 1”.

Flash flooding was not reported yesterday. For a look at precipitation estimates in your area, please see our State Precipitation Map below.

Click Here For Map Overview

The map below shows radar-estimated, rainfall gage-adjusted Quantitative Precipitation Estimates (QPE) across Colorado. The map is updated daily during the operational season (May 1 – Sep 30) by 11AM. The following six layers are currently available: 24-hour, 48-hour and 72-hour total precipitation, as well as maximum 1-hour, 2-hour and 6-hour precipitation over the past 24 hour period (to estimate where flash flooding may have occurred). The accumulation ending time is 6AM of the date shown in the bottom right corner. Also shown optionally are fire burn areas since 2012. The home button in the top left corner resets the map to the original zoom.

Note: We have identified a possible underestimation in QPE over the southwest part of the state. We are working to on this issue, and will provide an update as soon as possible.

SPM 05-12-2018: Isolated Showers/Thunderstorms Struggled as Best Support Remained across Wyoming

Issue Date: Saturday, May 12th, 2018
Issue Time: 9:30 AM MDT

Summary:

Warm and dry conditions could be found across much of the state yesterday, especially for those areas south of the I-70 corridor where dry southwest flow aloft dominated the forecast. To the north, a few isolated showers/thunderstorms were able to dot the area thanks to an influx of low-level moisture from the north and east, producing mainly gusty winds and light rainfall, with plenty of virga to go around. A few storms were able to produce between 0.1-0.25 inches of rainfall accumulation over the Front Range, Urban Corridor, and Northeast Plains; they couldn’t muster anything close to flooding thresholds.

If you look back to yesterday’s FTB, we discussed gusty winds thanks to a tightening pressure gradient, and that’s exactly what we got, especially across the western slope. Check out some of the stronger non-thunderstorm wind reports:

65 mph: Mt. Abrahms (Ouray County)
60 mph: Kendall Mountain (San Juan County)
57 mph: Eagle Mountain (San Juan County)
54 mph: Douglas Pass (Garfield County)

Flash flooding was not reported yesterday. For a look at precipitation estimates in your area, please see our State Precipitation Map below.

Click Here For Map Overview

The map below shows radar-estimated, rainfall gage-adjusted Quantitative Precipitation Estimates (QPE) across Colorado. The map is updated daily during the operational season (May 1 – Sep 30) by 11AM. The following six layers are currently available: 24-hour, 48-hour and 72-hour total precipitation, as well as maximum 1-hour, 2-hour and 6-hour precipitation over the past 24 hour period (to estimate where flash flooding may have occurred). The accumulation ending time is 6AM of the date shown in the bottom right corner. Also shown optionally are fire burn areas since 2012. The home button in the top left corner resets the map to the original zoom.

Note: We have identified a possible underestimation in QPE over the southwest part of the state. We are working to on this issue, and will provide an update as soon as possible.