SPM 05-23-2018: Scattered Thunderstorms Rumbled, Heaviest Rain Fell in Fort Collins

Issue Date: Wednesday, May 23rd, 2018
Issue Time: 9:30 AM MDT

Summary:

Ample moisture was in place across Colorado yesterday, and daytime heating was able to use it advantageously to trigger scattered showers/thunderstorms across the state. The best coverage occurred over the mountains where orographic effects provided a little additional support for thunderstorm development. Activity across the High Country was garden-variety, resulting in gusty winds and periods of light-to-moderate rainfall. A thunderstorm wind gust of 53 mph was reported in Grand Junction (Mesa County).

The strongest storms of the day, though, occurred over the Urban Corridor, Northeast Plains, Southeast Plains, and Palmer Ridge, where the best combination of shear and instability resided. One thunderstorm “complex,” in particular, used a northerly storm motion to impact the Denver metro area, Boulder, and Fort Collins, dumping small hail and periods of heavy rain. In fact, street flooding was reported in Fort Collins due to accumulating small hail clogging drainage allowing for water to pond across a few roadways and intersections.

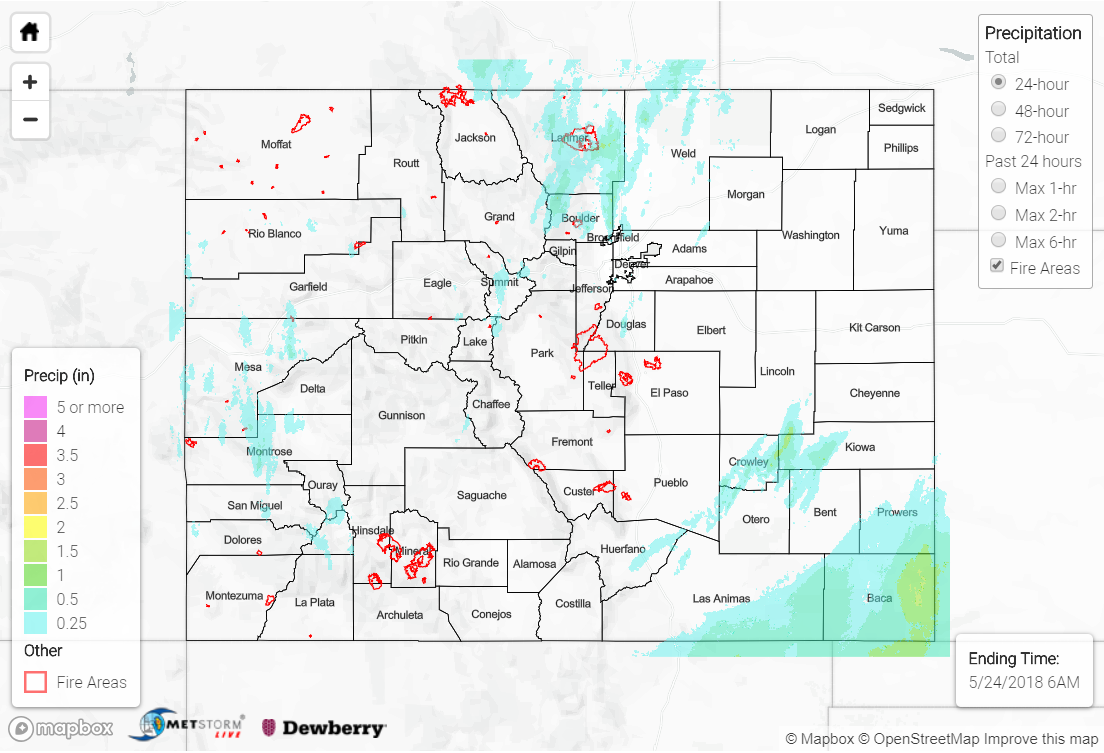
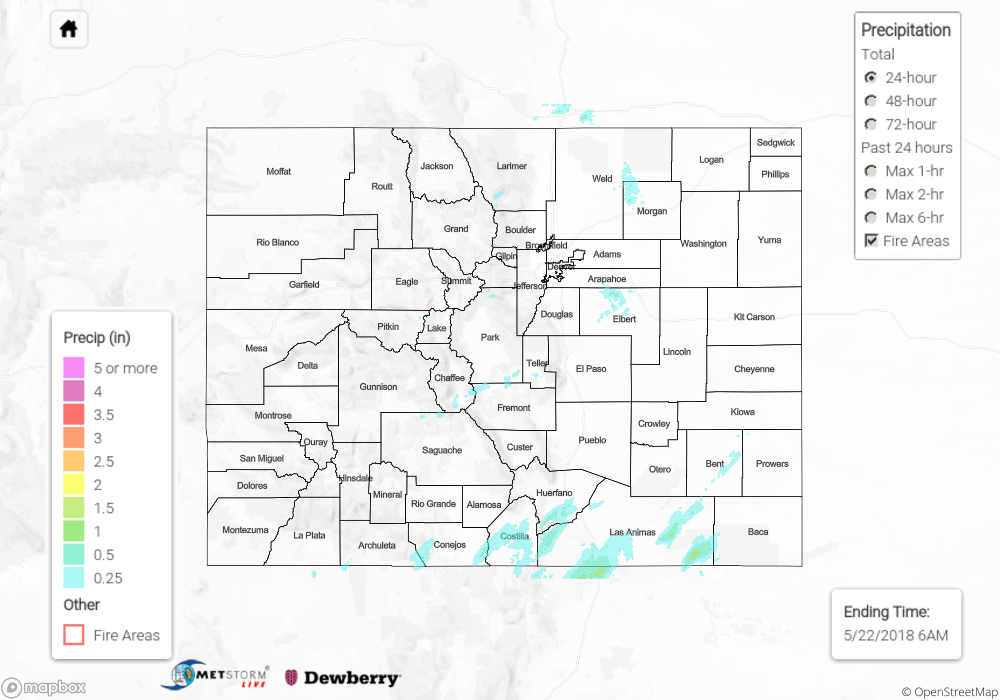
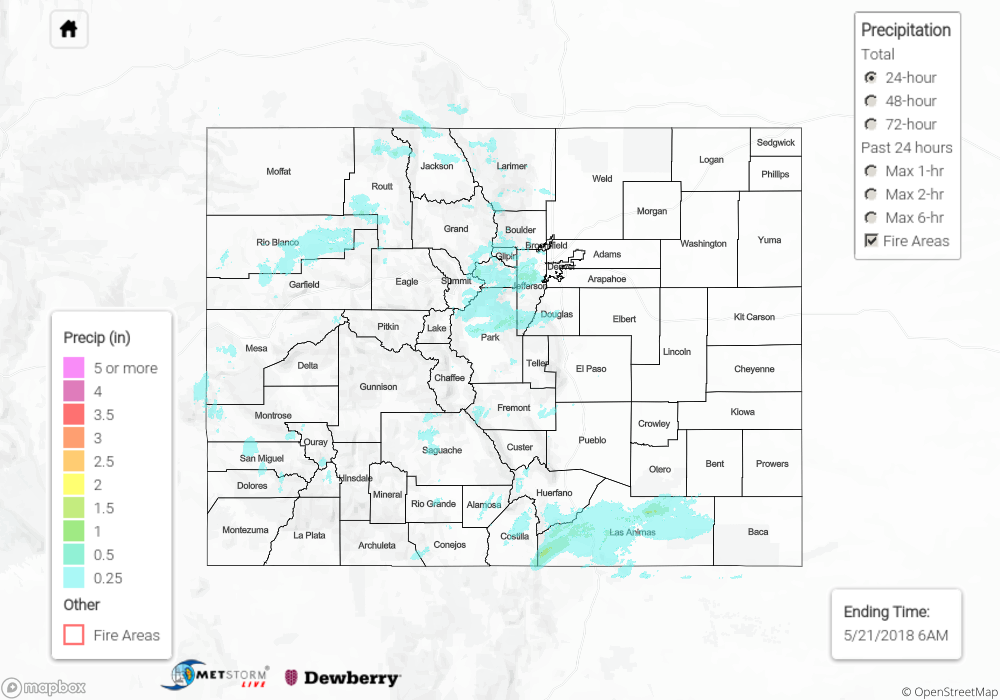
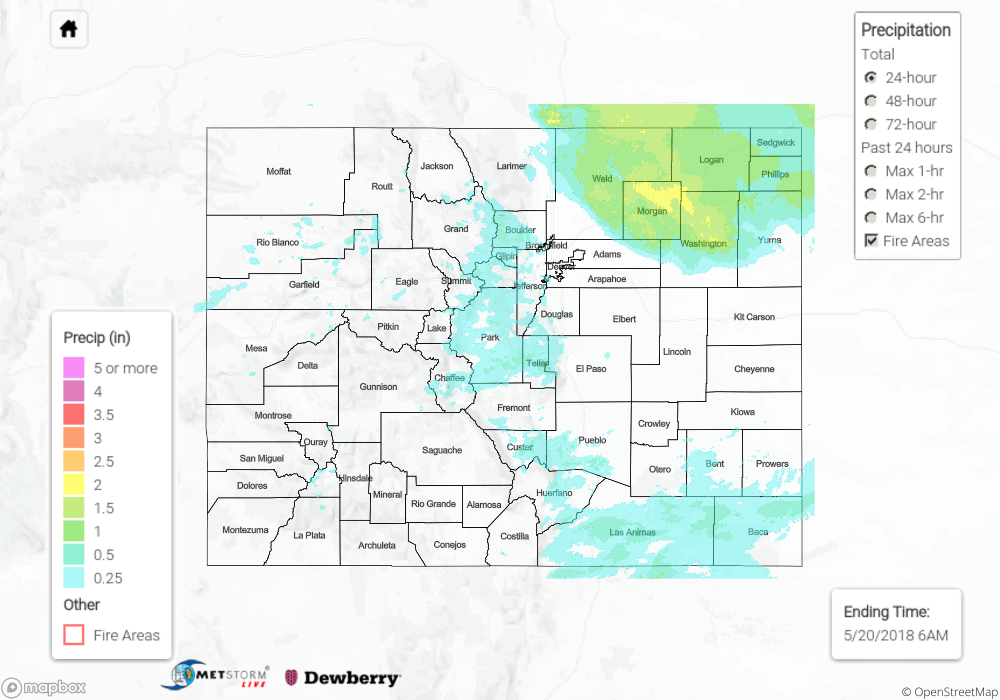
For a look at precipitation estimates in your area, please see our State Precipitation Map below.

Click Here For Map Overview

The map below shows radar-estimated, rainfall gage-adjusted Quantitative Precipitation Estimates (QPE) across Colorado. The map is updated daily during the operational season (May 1 – Sep 30) by 11AM. The following six layers are currently available: 24-hour, 48-hour and 72-hour total precipitation, as well as maximum 1-hour, 2-hour and 6-hour precipitation over the past 24 hour period (to estimate where flash flooding may have occurred). The accumulation ending time is 6AM of the date shown in the bottom right corner. Also shown optionally are fire burn areas since 2012. The home button in the top left corner resets the map to the original zoom.

Note: We have identified a possible underestimation in QPE over the southwest part of the state. We are working to on this issue, and will provide an update as soon as possible.

SPM 05-22-2018: Measurable Rainfall for Southern Colorado

Issue Date: Tuesday, May 22, 2018
Issue Time: 09:15AM MDT

Summary:

Showers and thunderstorms kicked off for southern Colorado just after noon yesterday with upper support from a shortwave. A couple stronger storms formed with small hail reported both in Alamosa and Durango. Alamosa airport recorded 0.12 inches of precipitation with nearby CoCoRaHS stations reporting 0.26 inches. Radar totals were estimated just over 0.25 inches in the San Luis Valley. To keep this is perspective, climatology at Alamosa airport for May is around 0.5 inches. These storms also produced a lot of winds with several airports reporting gusts up to 35 mph. A SNOTEL site in the Southeast Mountains reported 0.6 inches.

Later in the afternoon a line of storms formed over the Southeast Plains with the highest total over Las Animas County at 1 inch. Lastly, an isolated storm also fired over the Palmer Ridge. This storm produced a brief, weak tornado just after 5PM in an open field. Due to lower moisture, total rainfall was estimated just over 0.5 inches. By 11PM storms activity had stopped, with lingering showers over the far southeast corner for the state into the night.

No flooding was reported on Monday. For rainfall estimates in your area, scroll down to the State Precipitation Map below.

Click Here For Map Overview

The map below shows radar-estimated, rainfall gage-adjusted Quantitative Precipitation Estimates (QPE) across Colorado. The map is updated daily during the operational season (May 1 – Sep 30) by 11AM. The following six layers are currently available: 24-hour, 48-hour and 72-hour total precipitation, as well as maximum 1-hour, 2-hour and 6-hour precipitation over the past 24 hour period (to estimate where flash flooding may have occurred). The accumulation ending time is 6AM of the date shown in the bottom right corner. Also shown optionally are fire burn areas since 2012. The home button in the top left corner resets the map to the original zoom.

Note: We have identified a possible underestimation in QPE over the southwest part of the state. We are working to on this issue, and will provide an update as soon as possible.

SPM 05-21-2018: Widespread Thunderstorms for the Mountains and Western Slope

Issue Date: Monday, May 21, 2018
Issue Time: 10:15AM MDT

Summary:

The shortwave noted in the water vapor imagery yesterday (see FTB) helped trigger widespread showers and thunderstorms across the higher elevations by early afternoon on Sunday. More moisture was present over eastern Colorado, so with the help of the atmospheric dynamics, showers and thunderstorms kicked off by late in the morning. This brought some relief to the dry weather, but limited moisture caused more gusty winds than much needed rainfall. Both Montrose and Meeker airports reported gusts just above 50 mph due to the dry layer in the region. As far as rainfall totals, the highest reporting CoCoRaHS stations in the region were up to 0.1 inches with radar estimates a bit higher at 0.25 inches. Elsewhere, the southern Front Range and Urban Corridor, along with the Southeast Mountains, got some more rain to help with the spring green-up. Estimates by radar were up to 1 inch over the Raton Ridge with a couple SNOTEL stations near Breckenridge reporting 0.3 inches. No flooding was reported on Sunday.

On another note, the Yampa, Elk, Gunnison and Colorado Rivers have likely reached their peak flows for the season. The Yampa peak streamflow was measured at 2,570 cfs putting it at its lowest peak since 2012. The Elk is sitting around 1,570 cfs. Combined, the Gunnison and Colorado rivers had the third earliest peak recorded with 8,500 cfs. This puts the Gunnison and Colorado rivers at the fourth lowest peak streamflow ever recorded.

For rainfall estimates in your neighborhood on Sunday, scroll down to the State Precipitation Map below.

Click Here For Map Overview

The map below shows radar-estimated, rainfall gage-adjusted Quantitative Precipitation Estimates (QPE) across Colorado. The map is updated daily during the operational season (May 1 – Sep 30) by 11AM. The following six layers are currently available: 24-hour, 48-hour and 72-hour total precipitation, as well as maximum 1-hour, 2-hour and 6-hour precipitation over the past 24 hour period (to estimate where flash flooding may have occurred). The accumulation ending time is 6AM of the date shown in the bottom right corner. Also shown optionally are fire burn areas since 2012. The home button in the top left corner resets the map to the original zoom.

Note: We have identified a possible underestimation in QPE over the southwest part of the state. We are working to on this issue, and will provide an update as soon as possible.

SPM 05-20-2018: Abundant Rain in Northeast Corner, Spotty Light Rain Elsewhere

Issue Date: 5/20/2018
Issue Time: 12:10 PM

Summary:

Moisture from the Friday night/Saturday morning impulse continued to wrap back into northeastern parts of the state on Saturday morning. Areas along and northeast of a Wellington-Greeley-Last Chance line received at least 0.25” of rain on Saturday, mostly in the form of showers and drizzle that persisted until around mid-day. The top rainfall reports for the day were almost all from the northeast corner, with the exception of one station in Routt County on the western slope:

• 1.76” at Fleming 6.6 S (Logan Co.)
• 1.29” at Oak Creek 4.7 E (Routt Co.)
• 1.18” at Hillrose 1.2 NE (Morgan Co.)
• 1.12” at Akron (Washington Co.)
• 1.08” at Hillrose 2.5 SSW (Morgan Co.)

Spotty showers also occurred across the high terrain in essentially all parts of the state except the San Juan Mountains, but rainfall totals were generally light (0.25” or less). A few thunderstorms tracked across the Southeast Plains and Raton Ridge as well, producing pockets of 0.25” – 0.75” of rain across Las Animas and Baca counties.

Flooding occurred just north of the border in southeastern Wyoming and western Nebraska, but was not reported in Colorado on Saturday. For rainfall estimates in your area, check out our State Precipitation Map below.

Click Here For Map Overview

The map below shows radar-estimated, rainfall gage-adjusted Quantitative Precipitation Estimates (QPE) across Colorado. The map is updated daily during the operational season (May 1 – Sep 30) by 11AM. The following six layers are currently available: 24-hour, 48-hour and 72-hour total precipitation, as well as maximum 1-hour, 2-hour and 6-hour precipitation over the past 24 hour period (to estimate where flash flooding may have occurred). The accumulation ending time is 6AM of the date shown in the bottom right corner. Also shown optionally are fire burn areas since 2012. The home button in the top left corner resets the map to the original zoom.

Note: We have identified a possible underestimation in QPE over the southwest part of the state. We are working to on this issue, and will provide an update as soon as possible.