Issue Date: Wednesday, June 20th, 2018
Issue Time: 9:30 AM MDT
Summary:
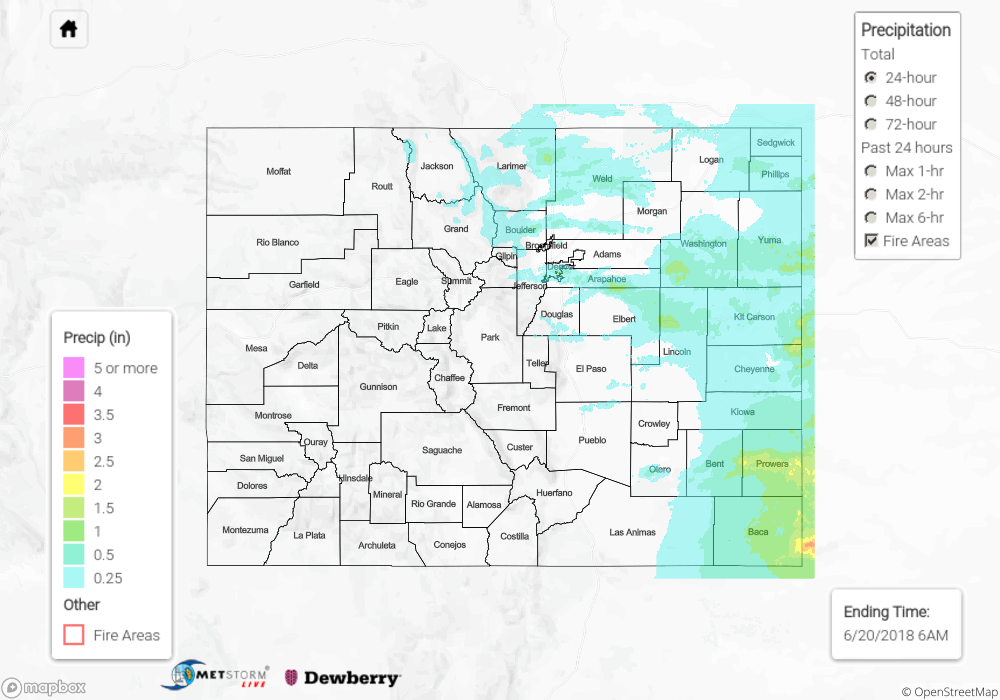
The previous FTB period was certainly an eventful one, as conditions came together to produce the most active severe weather day of the season thus far. Multiple rounds of supercells developed over/near the Front Range, tracking in a general eastward direction with time, impacting the Urban Corridor, Palmer Ridge, Northeast Plains, and Southeast Plains. The initially discrete supercells eventually morphed into multiple thunderstorm complexes over the eastern plains, resulting in plentiful rainfall and periods of heavy rain. Check out the following impressive heavy rainfall observations:
3.72 inches: Flagler (Kit Carson County)
1.5 inches: 3 miles NE of Idalia (Yuma County)
The big story yesterday, however, was the amount and size of hail produced by the severe thunderstorms. Up to 3 inch diameter hail was reported in El Paso County and Arapahoe County, 2.75 inch diameter hail in Yuma County and Park County, 2 inch hail in Weld, Denver, and Larimer Counties, plus a smattering of 1-1.75 inch hail across other portions of eastern Colorado.
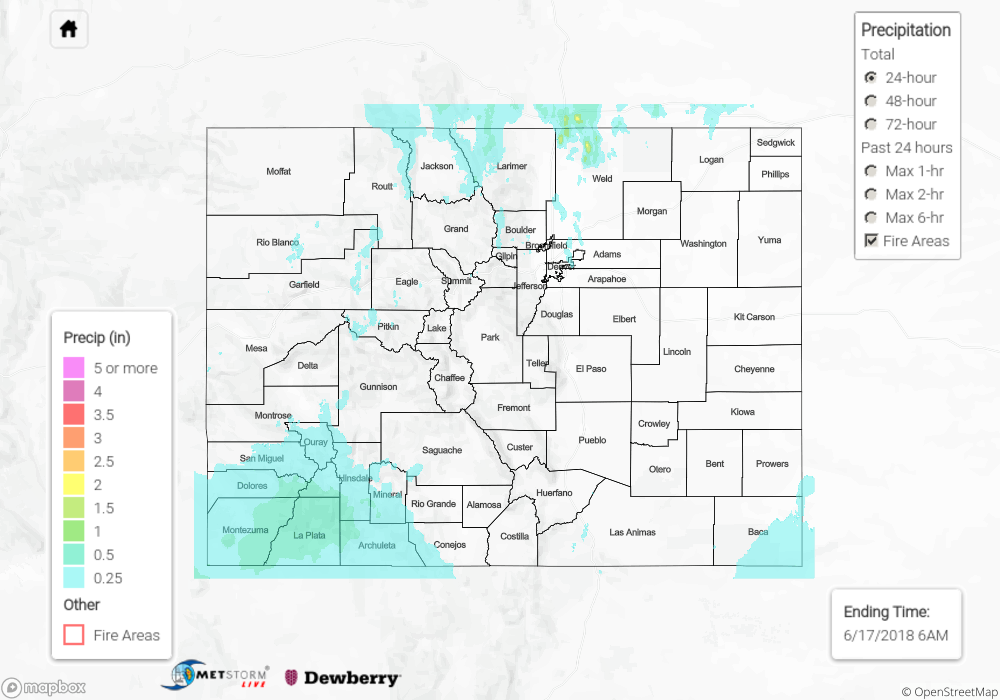
Flash flooding was not reported yesterday, but street/field ponding occurred under the heaviest rainfall in conjunction with hail accumulation and poor drainage. For a look at precipitation estimates in your area, please see our State Precipitation Map below.
Click Here For Map Overview
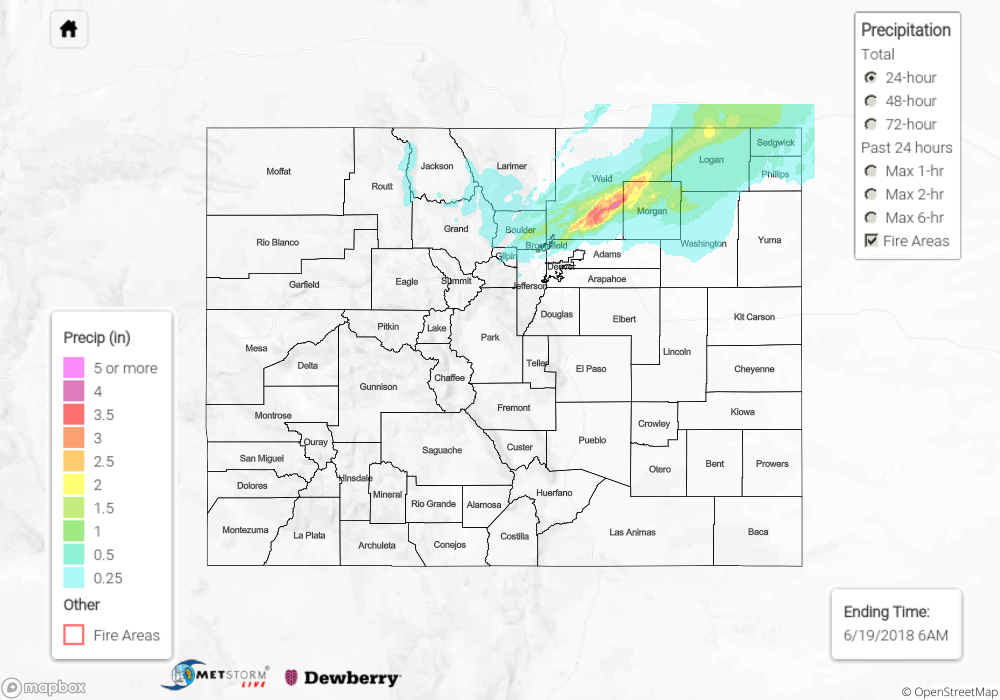
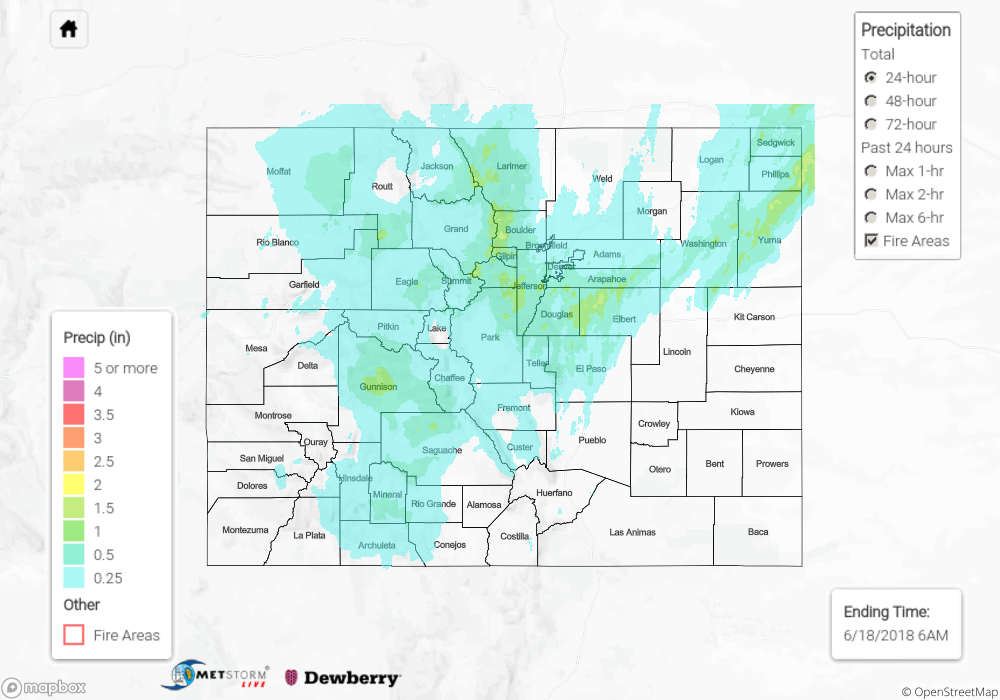
The map below shows radar-estimated, rainfall gage-adjusted Quantitative Precipitation Estimates (QPE) across Colorado. The map is updated daily during the operational season (May 1 – Sep 30) by 11AM. The following six layers are currently available: 24-hour, 48-hour and 72-hour total precipitation, as well as maximum 1-hour, 2-hour and 6-hour precipitation over the past 24 hour period (to estimate where flash flooding may have occurred). The 24-hour, 48-hour and 72-hour total precipitation contain bias corrections that are not disaggregated into the hourly estimates, so there will likely be some differences. The accumulation ending time is 6AM of the date shown in the bottom right corner. Also shown optionally are fire burn areas (post 2012), which are updated throughout the season to include new burn areas. The home button in the top left corner resets the map to the original zoom.