Issue Date: Tuesday, June 19, 2018
Issue Time: 10:20AM MDT
Summary:
The atmosphere yesterday was primed for severe weather and heavy rainfall. The Denver cyclone helped pull in high moisture over the Northeast Plains and Urban Corridor with stations recording dew points between 55F-60F. Thunderstorms kicked off a bit later than usual (5PM) over the Front Range, so the atmosphere was able to maximize its parameters for severe weather. A line of convergence provided lift for several supercells along and just north of I-76. Thanks to upper air support and a high moisture environment, the storms continued to redevelop to the west. Storm motion was to the northeast along the convergence line and lasted through 5AM this morning. There are still some lingering showers and heavy fog in their wake this morning.
As expected, these storms produced very high rainfall, gusty winds and large hail. Hail reports yesterday ranged from quarter (1 inch) to tennis ball (2.5 inches) and caused quite a bit of damage in Louisville and Lafayette. For more storm reports you can visit the NWS Boulder page. Around 9:00 PM one of the storms became a small bow echo and produced a wind gust of 71 mph in Fort Morgan. As for rainfall, a CoCoRaHS gage recorded 4.84 inches in Keenesburg with 2.47 inches falling in 40 minutes. Radar estimates just north of this area were just under 5 inches and max 1-hr rain rates reached 2.75 inches/hour! The total rainfall over Weld County translates to about a 1 in 100 year event or has a 1% chance of occurrence each year.
Not surprisingly, there were two flood warnings and an areal flood advisory. The frontage road at I-76 and Weld County Road 53 was washed out and many other roads in the area were impassable. A CoCoRaHS member in Weld County reported the dry soils were able to soak up an incredible amount of the rainfall yesterday. Today, these areas will have to be monitored closely as saturated soils will produce increased runoff. There were no other flooding reports as of this morning. River levels should be able to recover starting this morning and remained well below Action stage yesterday.
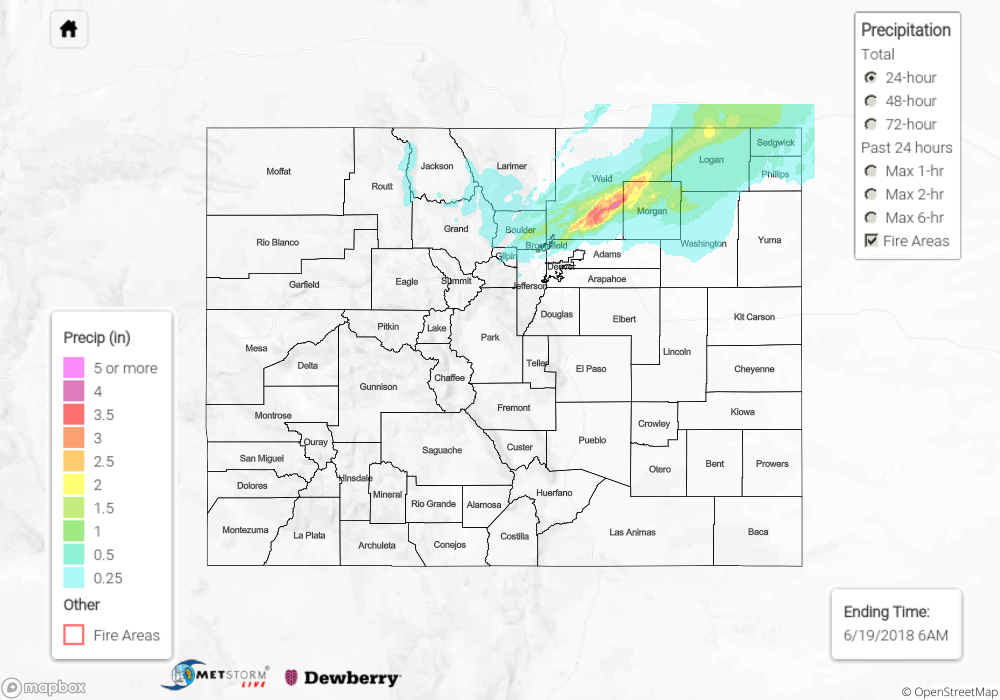
To see how much precipitation fell in your area on Monday, scroll down to the State Precipitation Map below.
Click Here For Map Overview
Note: We have identified a possible underestimation in QPE over the southwest part of the state. We are working to on this issue, and will provide an update as soon as possible.