Issue Date: Monday, June 18, 2018
Issue Time: 10:50AM MDT
Summary:
Bud continued to impact the weather over Colorado on Sunday. However, the moisture axis shifted to the east of the Continental Divide, which gave the burn scars over the San Juan Mountains a break from the heavy rainfall as it moved into a dry slot. A cold front moved through eastern Colorado on Sunday morning, which increased convergence along it and cooled high temperatures for the day. During the afternoon, the upper level low combined with the surface front to create widespread showers and severe thunderstorms over the northeast portion of the state.
Most of this region got a good soaking throughout the day and overnight at least receiving 0.25 inches of rainfall. Over the Front Range, Alert gages recorded up to 1.26 inches near Evergreen. While no mountain rivers indicated flooded yesterday with moderate rainfall rates, most showed a rise in the gage height thanks to the multiple rounds of rainfall. In Avon, a small mud flow closed the west bound lane of I-70 due to the all of the rain. Radar estimates and SNOTEL sites in the area indicated up to 1.4 inches of rain fell yesterday.
Over the Urban Corridor, an Alert gage in eastern Douglas County recorded 1.54 inches, which triggered an areal flood advisory around 2:40PM. CoCoRaHS gages in the area recorded up to 1.75 inches for the 24-hour period. Further east over the Northeast Plains, thunderstorms were more severe with hail up to 1.25 inches and a few tornado warnings. A brief tornado was reported in Sedgwick County near Julesburg at 2:20 PM, but no damage was reported. Max 1-hour rain rates were estimated up to 1 inch with 24 hour totals in the 1-1.5 inch range.
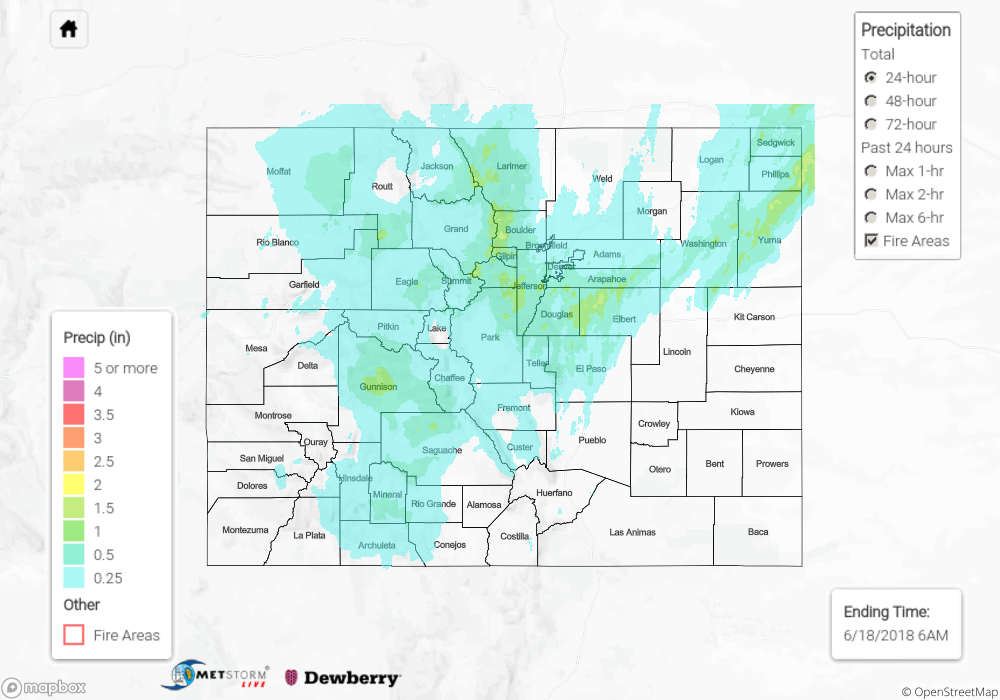
To see how much precipitation fell in your area on Sunday, scroll down to the State Precipitation Map below.
Click Here For Map Overview
Note: We have identified a possible underestimation in QPE over the southwest part of the state. We are working to on this issue, and will provide an update as soon as possible.