Issue Date: Sunday, June 17th, 2018
Issue Time: 9:30 AM MDT
Summary:
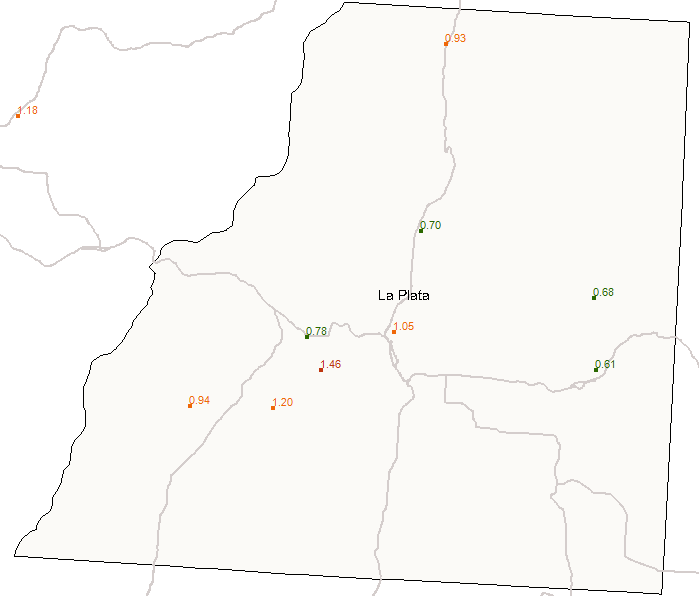
The remnants of Bud overspread the state yesterday, increasing moisture and providing plenty of cloud cover, especially west of the Continental Divide. A more robust dry slot than expected in the mid-level moisture held the main flooding concerns off until the overnight hours, when a burst of shower/thunderstorm activity over the Southwest Slope impacted the 416 Fire burn area. This burst occurred between the hours of 3 AM and 6 AM, with lingering showers continuing to impact the area this morning. At 5:53 AM MDT, trained spotters reported flash flooding with rock and debris across Highway 550 just north of Durango. Rain rates between 0.25-0.50 inches/hour were reported by the National Weather Service, showing just how quickly the burn scar reacted to moderate precipitation. CoCoRaHS observers across La Plata County reported more than 0.70 inches in the general vicinity of the 416 Fire burn area, with localized values greater than 1 inch.
East of the Continental Divide, scattered thunderstorms rumbled during the afternoon and evening hours, across two main areas: 1) The Northeast Plains, northern Front Range, and northern Urban Corridor, where an increase in moisture from the east/northeast and convergence along a surface boundary aided thunderstorm development, and 2) along the CO/KS border, where a plume of moisture from Bud overspread the area in conjunction with daytime heating. Some street ponding occurred across portions of the northern Urban Corridor, where the strongest thunderstorm complex of the day produced small hail and a period of moderate-to-heavy rainfall.
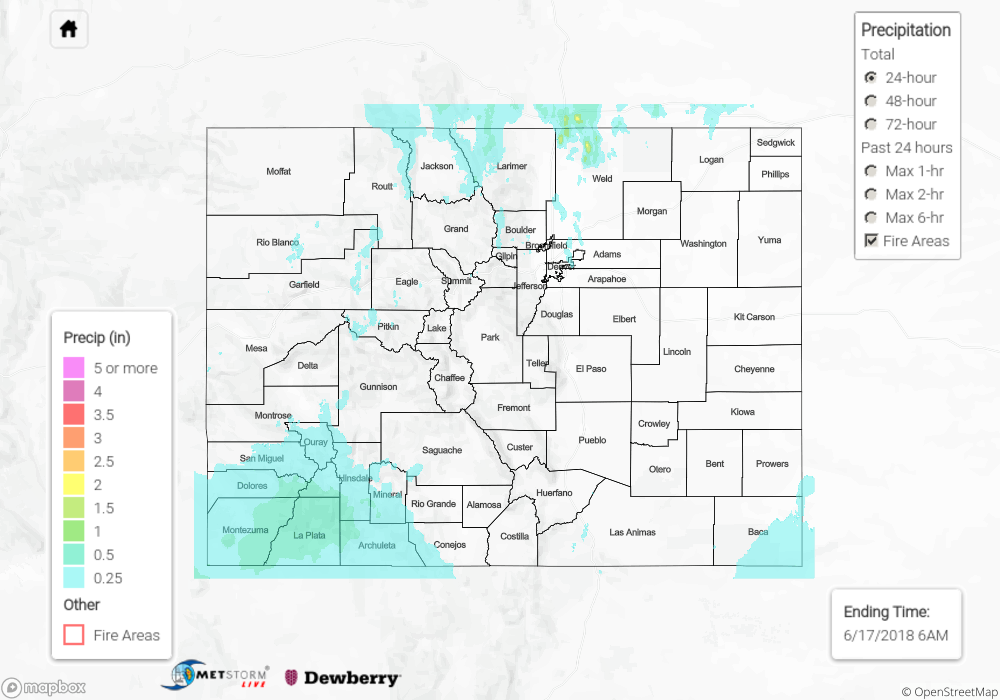
For a look at precipitation estimates in your area, please see our State Precipitation Map below.
Click Here For Map Overview
Note: We have identified a possible underestimation in QPE over the southwest part of the state. We are working to on this issue, and will provide an update as soon as possible.