SPM 07-25-2022: Widespread Heavy Rain and Flooding

Issue Date: Monday, July 25th, 2022
Issue Time: 11:00 AM MDT

Summary:

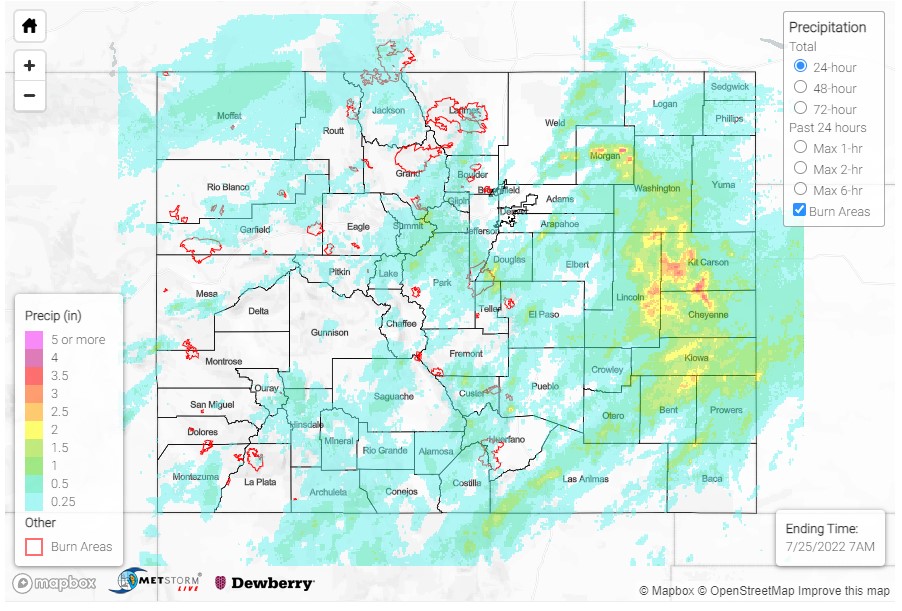
Showers and thunderstorms began early for the Grand Valley, Western Slopes, and Northern Mountains yesterday associated with an incoming low-pressure system, which acted to funnel ample monsoonal moisture into the state from the southwest. As the morning progressed, storms grew in coverage and expanded eastward into Central and San Juan Mountains, as well as the Front Range, and by afternoon widespread showers and thunderstorms covered much of the high elevations, Front Range, Urban Corridor, Palmer Ridge, and Northeast Plains. Daytime heating allowed for an increase in energy and therefore increased severe threat on the Eastern Plains, where numerous severe thunderstorm warnings were issued for large hail, high winds, and even a tornado.The eastward progression of the low resulted in drying from west to east, so by sundown most of the action was well onto the Northeast and Southeast Plains. Widespread heavy rain continued for the Southeast Plains and portions of the Raton Ridge until the very early morning hours this morning. With plenty of moisture at the surface from yesterday’s rain, many woke up to lingering foggy conditions this morning across the Eastern Plains and Urban Corridor.

There were several flood reports from yesterday’s heavy rain, including two on the Cameron Peak burn scar – which continues to remain particularly sensitive. A flash flood warning was issued yesterday afternoon for Larimer County, including the burn scar, after radar indicated thunderstorms producing heavy rain. Flooding was reported at the southern extent of the scar near Glen Haven, where the Miller Fork overtopped CR 43. Flooding was also reported near Buckhorn Mountain, where Sheep Creek overtopped CR 44H in the central portion of the burn scar. Rainfall observations are limited on the burn scar itself, but 0.94 inches was reported by the public in Glen Haven in the Big Thompson Canyon, and a CoCoRaHS report of 1.14 inches was made in Drake.

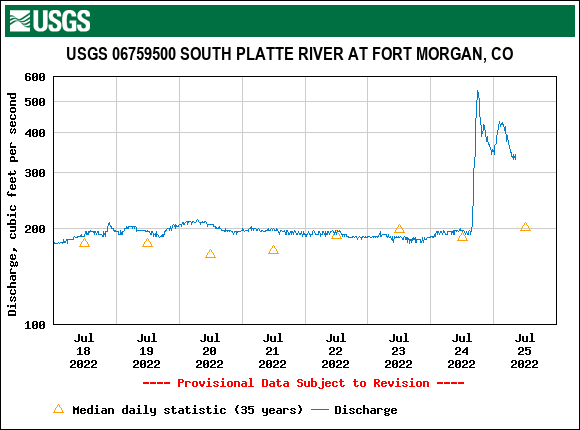
Flash flooding was also reported in Fort Morgan and Brush, along the I-76 corridor. CR28 was reported to be completely under water and washed out south of the river, and the basement of some residences also flooded. An impressive 3.50 inches of rain was reported from a Trained Spotter near Brush. Following the heavy rain, the South Platte River at Fort Morgan rapidly rose from around 200 cfs to over 500 cfs yesterday, as seen in the hydrograph below.

A Flash Flood was also reportd near Aroya, including standing water on Highway 94 between mile markers 83 and 86. Nearby, law enforcement reported visibility was down to 0 miles during the heaviest rain. Due to the rural location, there are limited reports for Aroya, though there are several observations exceeding 1.25 inches, and a few up to 1.50-1.85 in Lincoln and Kit Carson Counties.

Rainfall totals were less impressive for the Urban Corridor, though quick bursts of rain on impervious surfaces resulted in street flooding. Weather Nation shared the following video of street flooding in Northglenn. Between 0.30-0.50 was reported from CoCoRaHS observers in this area.

Flash flood warnings were also issued for a portion of Mesa County in the Grand Valley, as well a small area of the Southern Front Range, and in Colorado Springs, though no flooding has been reported so far. The Grizzly Creek burn scar also had a warning issued. Rainfall totals between 0.30-0.46 were reported on the burn scar in Glenwood Canyon, but no flooding was reported. CDOT is still closing I-70 for flood warnings in Glenwood Canyon on the burn scar though.

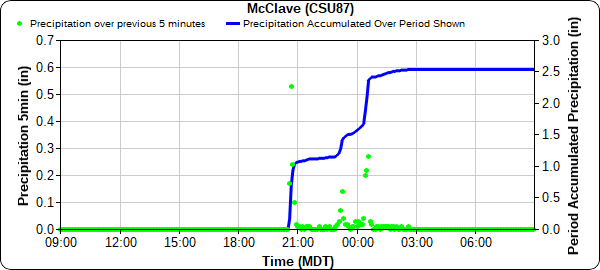
Impressive rainfall totals were reported up and down the Urban Corridor, Palmer Ridge, and Eastern Plains even without flooding. A CoAgMet station, McClave in Southeast Plains as seen in the hyetograph below, picked up 2.54 inches in 24-hours yesterday. More impressive though, 0.53 of that came in just 5-minutes. This 5-minue total is just below the 10-year average recurrence interval precipitation value of 0.57 inches in 5-minutes for this location.

Some other notable totals across the Northeast and Southeast Plains:

  • 2.47 in Brandon
  • 2.28 in Eads
  • 1.33-2.23 in Brush
  • 2.02 in Las Animas
  • 2.01 in Flagler
  • 1.68 in Lamar
  • 1.52 in Karval
  • 1.29 in Cheyenne Wells

Some other notable totals for the Urban Corridor and Palmer Ridge:

  • 1.29 in Castle Rock
  • 1.28 in Hugo
  • 1.18 in The Pinery
  • 1.04 in Security
  • 0.84 in Limon

Of note in the MetStorm Live QPE today – observers near Pagosa Springs reported between 0.90-1.54 inches of rain yesterday, however QPE below shows only 0.25-0.50 inches. This southwest portion of the state is notoriously underestimated due to it’s distance from radars. For precipitation estimates in our area, check out the map below.

Remember, if you observe flooding in your area please use the “Report a Flood” page to make a flood report when you can safely do so.
Click Here For Map Overview

The map below shows radar-estimated, rainfall gage-adjusted Quantitative Precipitation Estimates (QPE) across Colorado. The map is updated daily during the operational season (May 1 – Sep 30) by 11AM. The following six layers are currently available: 24-hour, 48-hour and 72-hour total precipitation, as well as maximum 1-hour, 2-hour and 6-hour precipitation over the past 24 hour period (to estimate where flash flooding may have occurred). The accumulation ending time is 7AM of the date shown in the bottom right corner. Also shown optionally are vulnerable fire burn areas (post 2012), which are updated throughout the season to include new, vulnerable burn areas. The home button in the top left corner resets the map to the original zoom.

SPM 2022-07-24: Debris Flow on East Troublesome Burn Scar, Rain Across Colorado

Issue Date: Sunday, July 24th, 2022
Issue Time: 10:30 AM MDT

Summary:

There were high winds yesterday in the northwest quadrant of Colorado, the highest of which was a 57 mph non-thunderstorm wind gust. The Southern Plains also saw some high winds, this time associated with overlapping thunderstorm warnings issued for approximately 6:30-7:45 yesterday evening. There was also a flood advisory issued for the same area. The winds in this area reached up to 75 mph, reported near Lamar, along with up to 0.63” in precipitation. The Northern Plains had some rainfall as well, but only a few hundredths of an inch.

The northern Front Range received many flood advisories from the precipitation yesterday, notably on the Cameron Peak, East Troublesome, and Calwood burn scars. From Fort Collins down to Broomfield, the Urban Corridor received varying amounts of rainfall, from 0.15”- 0.7” depending on location. Many CoCoRaHS reports noted two rounds of storms.

Although it seems there was no flooding near Cameron Peak or Calwood, a debris flow was only reported over Highway 125 on the East Troublesome burn scar. Up to 0.47” was reported on the burn scar near where the debris flow occurred. The highway is closed by approximately 8:30 p.m. yesterday, between Trail Creek and FS Road 112, due to the debris flow and flash flooding. See below for photos from the Grand County Sherriff that show the extent of the damage.

Across the rest of the state there was more rainfall, although quite less than above. Along the southern Urban Corridor, Colorado Springs and Denver saw totals at or below 0.2”. In the San Juan Mountains and south-central portion of the state, highest observations include:
– 0.4” near Gunnison
– 0.53” in Silverton
– 0.39” in Trinidad and Saguache

If you observe flooding in your area, remember to use the “Report a Flood” page to make any flood reports when you can safely do so. For precipitation estimates in our area, check out the map below.

Click Here For Map Overview

The map below shows radar-estimated, rainfall gage-adjusted Quantitative Precipitation Estimates (QPE) across Colorado. The map is updated daily during the operational season (May 1 – Sep 30) by 11AM. The following six layers are currently available: 24-hour, 48-hour and 72-hour total precipitation, as well as maximum 1-hour, 2-hour and 6-hour precipitation over the past 24 hour period (to estimate where flash flooding may have occurred). The accumulation ending time is 7AM of the date shown in the bottom right corner. Also shown optionally are vulnerable fire burn areas (post 2012), which are updated throughout the season to include new, vulnerable burn areas. The home button in the top left corner resets the map to the original zoom.

SPM 07-23-2022: Quieter Friday

Issue Date: Saturday, July 23rd, 2022
Issue Time: 9:00 AM MDT

Summary:

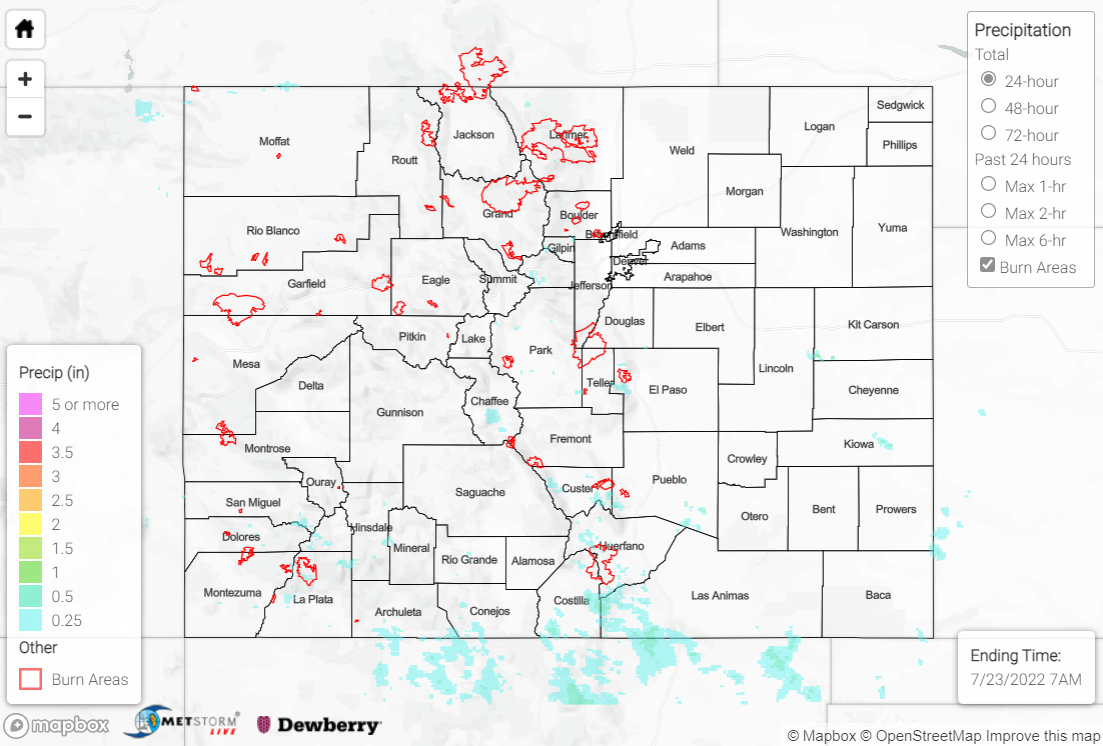
Friday saw even less coverage of precipitation than Thursday, as dry air and rising heights aloft limited convective development. Weak showers and storms were strictly confined to the high elevations and foothills, with the highest, albeit still scattered at best, coverage over the southern mountains and Raton Ridge. Precipitation totals were light, with rain gauge observations of T-0.20” where rain was observed. The heaviest rain fell across Costilla and southwestern Las Animas Counties, where QPE data suggests localized amounts up to 0.50”. Temperatures remained hot across the state, as well.

No flooding was reported yesterday; if you observe flooding in your area, remember to use the “Report a Flood” page to make any flood reports when you can safely do so. For precipitation estimates in our area, check out the map below.

Click Here For Map Overview

The map below shows radar-estimated, rainfall gage-adjusted Quantitative Precipitation Estimates (QPE) across Colorado. The map is updated daily during the operational season (May 1 – Sep 30) by 11AM. The following six layers are currently available: 24-hour, 48-hour and 72-hour total precipitation, as well as maximum 1-hour, 2-hour and 6-hour precipitation over the past 24 hour period (to estimate where flash flooding may have occurred). The accumulation ending time is 7AM of the date shown in the bottom right corner. Also shown optionally are vulnerable fire burn areas (post 2012), which are updated throughout the season to include new, vulnerable burn areas. The home button in the top left corner resets the map to the original zoom.

SPM 07-22-2022: Hotter and Drier, Less Coverage of Storms

Issue Date: Friday, July 22nd, 2022
Issue Time: 9:30 AM MDT

Summary:

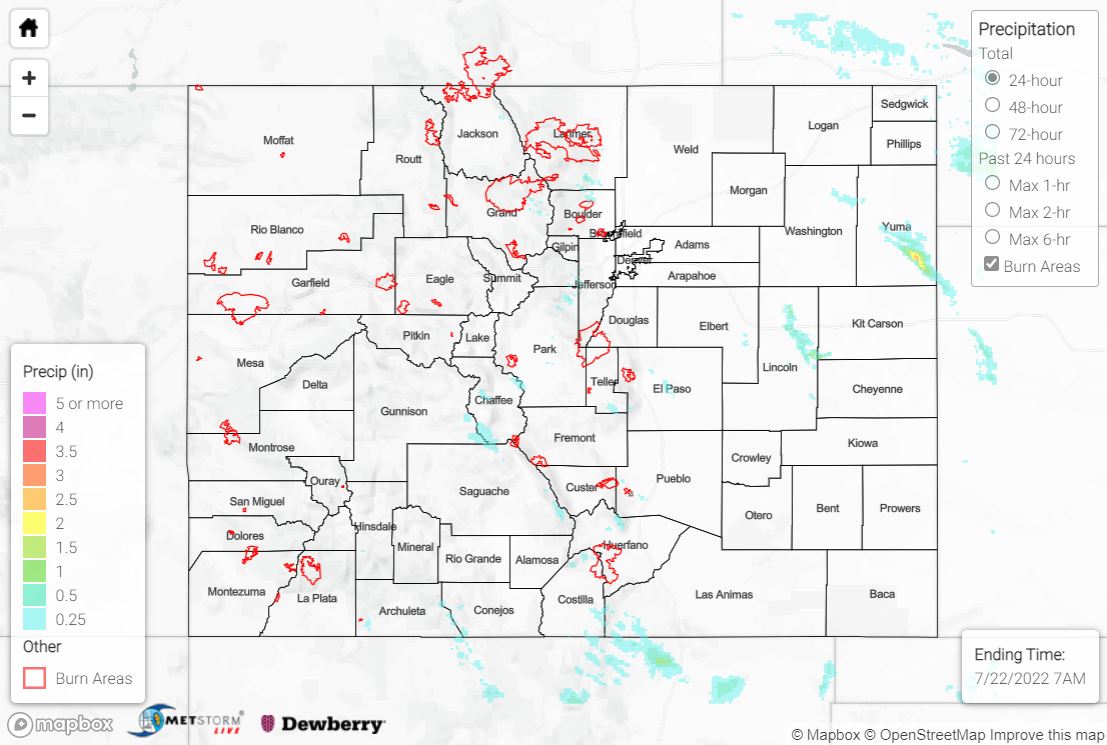
The heat continued Thursday with rising heights and warming temperatures aloft as the upper-level ridge shifted slightly eastward. Drier air, especially near the surface, was also able to work its way into the state. Together, the warmer temperatures aloft and drier air helped to suppress both convective intensity and coverage for most of Colorado. Nonetheless, isolated storms developed over the high terrain by midday, especially across the southern Front Range and into Park County. Convection remained confined to the mountains and foothills, with cells dissipating if they tried to move out into the adjacent Plains. Precipitation amounts were generally T-0.20” for the high elevations and Urban Corridor, although an automated station northeast of Ft. Collins reported 0.52”.

Farther east across the eastern Northeast Plains, better low-level moisture persisted, and two cells were able to produce heavier rainfall. Rain gauge coverage is sparse, but QPE data suggests localized totals of 1-2” across portions of northeast Lincoln and southeast Yuma Counties.

No flooding was reported yesterday; if you observe flooding in your area, remember to use the “Report a Flood” page to make any flood reports when you can safely do so. For precipitation estimates in our area, check out the map below.

Click Here For Map Overview

The map below shows radar-estimated, rainfall gage-adjusted Quantitative Precipitation Estimates (QPE) across Colorado. The map is updated daily during the operational season (May 1 – Sep 30) by 11AM. The following six layers are currently available: 24-hour, 48-hour and 72-hour total precipitation, as well as maximum 1-hour, 2-hour and 6-hour precipitation over the past 24 hour period (to estimate where flash flooding may have occurred). The accumulation ending time is 7AM of the date shown in the bottom right corner. Also shown optionally are vulnerable fire burn areas (post 2012), which are updated throughout the season to include new, vulnerable burn areas. The home button in the top left corner resets the map to the original zoom.