SPM 07-02-2018: Plentiful Sunshine with Increasing Temperatures

Issue Date: Monday, July 2, 2018
Issue Time: 10:25AM MDT

Summary:

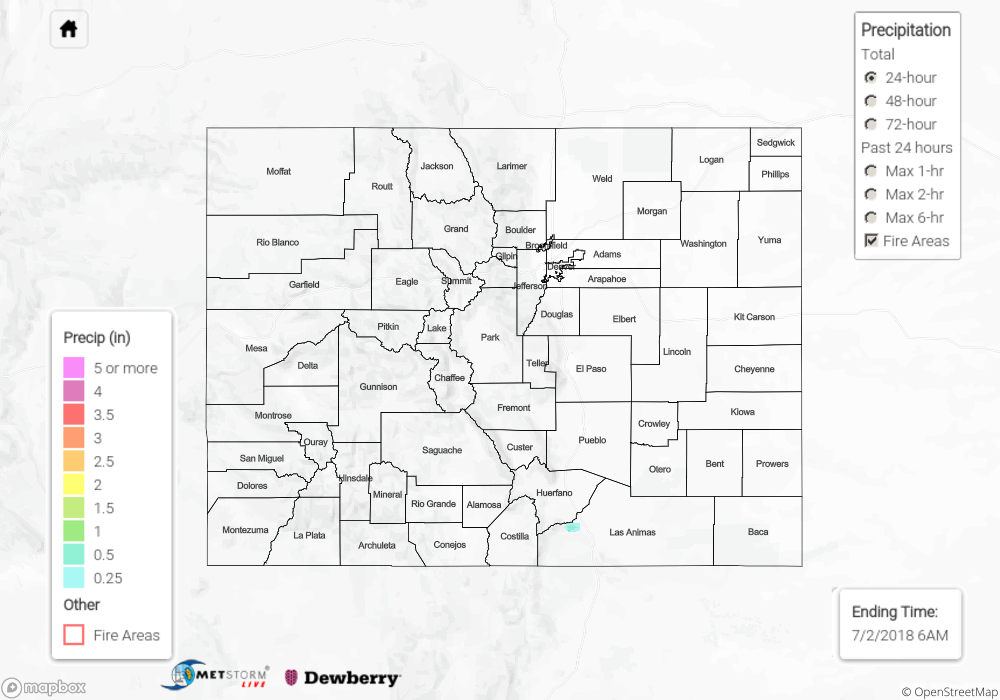
Westerly flow aloft began the drying process after the passage of the trough on Saturday. Paired with downward motion behind the trough, thunderstorm activity was quite suppressed. The warm, southwesterly air also started to increase high temperatures, and high climbed quite a few degrees when compared to Saturday afternoon. Diurnal flow helped initiate a few showers and cloud cover over the San Juan Mountains, Southern Front Range and Southeast Mountains. With limited moisture, most storm totals were under 0.1 inches. One stronger storm formed over the Southeast Mountains northwest of Trinidad and a CoCoRaHS station recorded 0.37 inches. Radar estimations were just under 1 inch over the core of the storm.

Flooding was not reported on Sunday. To see how much precipitation fell in your area, scroll down to the State Precipitation Map below.

Click Here For Map Overview

The map below shows radar-estimated, rainfall gage-adjusted Quantitative Precipitation Estimates (QPE) across Colorado. The map is updated daily during the operational season (May 1 – Sep 30) by 11AM. The following six layers are currently available: 24-hour, 48-hour and 72-hour total precipitation, as well as maximum 1-hour, 2-hour and 6-hour precipitation over the past 24 hour period (to estimate where flash flooding may have occurred). The 24-hour, 48-hour and 72-hour total precipitation contain bias corrections that are not disaggregated into the hourly estimates, so there will likely be some differences. The accumulation ending time is 6AM of the date shown in the bottom right corner. Also shown optionally are fire burn areas (post 2012), which are updated throughout the season to include new burn areas. The home button in the top left corner resets the map to the original zoom.

SPM 07-01-2018: Cooler with Scattered Showers and Thunderstorms East of the Divide

Issue Date: Sunday, July 1st, 2018
Issue Time: 9:30 AM MDT

Summary:

The anticipated upper-level trough moved across the Rockies yesterday, bringing with it cooler temperatures and broad support for the development of scattered showers and thunderstorms. Upslope flow transported good surface moisture into eastern Colorado, providing the fuel for wetting rains and the wind shear necessary for a few strong-to-severe thunderstorms. Severe storm reports to the National Weather Service are as follows:

60 mph thunderstorm wind gust: 7 miles of Heartstrong (Yuma County), 7 miles SW of Idalia (Yuma County), 2 miles NNW of Hale (Yuma County)
58 mph thunderstorm wind gust: 2 miles NNW of Hale (Yuma County)
1.75 inch hail: 7 miles SW of Idalia (Yuma County)
1.50 inch hail: 3 miles N of Colorado Springs (El Paso County), 7 miles S of Idalia (Yuma County), 6 miles W of Bonny Reservoir (Yuma County)
1.25 inch hail: 4 miles NNW of Peterson AFB (El Paso County)
…and a smattering of 1 inch hail reports from El Paso County, Weld County, and Larimer County.

The bulk of shower/thunderstorm activity occurred during the afternoon and early evening hours, along and east of I-25. A second round of thunderstorms developed over the Palmer Ridge, southern portions of the Northeast Plains, and Southeast Plains after 8 PM. This line of storms drifted slowly south-southeastward, diminishing/exiting the state during the early morning hours.

No flash flooding occurred yesterday. For a look at precipitation estimates in your area, please see our State Precipitation Map below.

Click Here For Map Overview

The map below shows radar-estimated, rainfall gage-adjusted Quantitative Precipitation Estimates (QPE) across Colorado. The map is updated daily during the operational season (May 1 – Sep 30) by 11AM. The following six layers are currently available: 24-hour, 48-hour and 72-hour total precipitation, as well as maximum 1-hour, 2-hour and 6-hour precipitation over the past 24 hour period (to estimate where flash flooding may have occurred). The 24-hour, 48-hour and 72-hour total precipitation contain bias corrections that are not disaggregated into the hourly estimates, so there will likely be some differences. The accumulation ending time is 6AM of the date shown in the bottom right corner. Also shown optionally are fire burn areas (post 2012), which are updated throughout the season to include new burn areas. The home button in the top left corner resets the map to the original zoom.

SPM 06-30-2018: Slightly Cooler with a Few More High-Based Showers and Thunderstorms

Issue Date: Saturday, June 30th, 2018
Issue Time: 9:30 AM MDT

Summary:

The upper-level ridge was knocked down a bit yesterday by a passing shortwave and the approach of a larger-scale upper-level trough. This allowed for high temperatures to come down by a few degrees compared to Thursday’s records, which was a welcome relief. The shortwave acted as a trigger during the afternoon and evening hours, setting off scattered high-based showers/thunderstorms over/near the higher terrain where orographic effects aided lift, but a lack of moisture resulted in very little (if any) rainfall. Another area of showers/thunderstorms was driven by surface convergence along a lee trough over the eastern plains. To the east of this boundary, and near the eastern CO state line, dewpoints were able to climb into the 50s and near 60 F, providing fuel for a few high-based thunderstorms that were able to produce a little bit of rainfall (less than 0.25 inches) and plenty of gusty winds. The strongest wind reports from yesterday were:

3 miles E of Firstview (Cheyenne County): 52 mph wind gust
3 miles E of Sheridan Lake (Kiowa County): Several telephone poles blown down from MM 192-197 on Highway 96.

No flash flooding occurred yesterday. For a look at precipitation estimates in your area, please see our State Precipitation Map below.

Click Here For Map Overview

The map below shows radar-estimated, rainfall gage-adjusted Quantitative Precipitation Estimates (QPE) across Colorado. The map is updated daily during the operational season (May 1 – Sep 30) by 11AM. The following six layers are currently available: 24-hour, 48-hour and 72-hour total precipitation, as well as maximum 1-hour, 2-hour and 6-hour precipitation over the past 24 hour period (to estimate where flash flooding may have occurred). The 24-hour, 48-hour and 72-hour total precipitation contain bias corrections that are not disaggregated into the hourly estimates, so there will likely be some differences. The accumulation ending time is 6AM of the date shown in the bottom right corner. Also shown optionally are fire burn areas (post 2012), which are updated throughout the season to include new burn areas. The home button in the top left corner resets the map to the original zoom.

SPM 06-29-2018: Heat Records Broken

Issue Date: Friday, June 29, 2018
Issue Time: 09:30AM MDT

Summary:

Yesterday, the strong ridge continued to build and under that ridge, record heat occurred. The high in Denver reach 105F by 3PM, which ties the all-time record set in 1878, 2005 and 2012 (x2) . Several other cities recorded their highest temperature ever for June 28th including Greeley and Fort Collins. The highest recorded temperature over the last 24-hours was in Lamar where it reached 109F! The Southeast Plains are expected to break the 100F mark again today.

As forecast, not much low-level moisture was available for rainfall yesterday, so instead there were a lot of mid-level clouds in the afternoon as the atmosphere reached the convective temperature. A couple stronger thunderstorms formed over the eastern plains and Raton Ridge along a line of convergence. Max 1-hour rain rates were estimated just over 0.5 inches and strong wind gusts were recorded. A gust of 74mph was measured at Lamar Airport with several other areas receiving gusts between 45-60 mph. The breezy conditions were not helpful to the fires that continue to burn across the state. Storms quickly came to an end after the sunset when the instability rapidly dropped off.

To see how much precipitation fell in your area yesterday, scroll down to the State Precipitation Map below.

Click Here For Map Overview

The map below shows radar-estimated, rainfall gage-adjusted Quantitative Precipitation Estimates (QPE) across Colorado. The map is updated daily during the operational season (May 1 – Sep 30) by 11AM. The following six layers are currently available: 24-hour, 48-hour and 72-hour total precipitation, as well as maximum 1-hour, 2-hour and 6-hour precipitation over the past 24 hour period (to estimate where flash flooding may have occurred). The 24-hour, 48-hour and 72-hour total precipitation contain bias corrections that are not disaggregated into the hourly estimates, so there will likely be some differences. The accumulation ending time is 6AM of the date shown in the bottom right corner. Also shown optionally are fire burn areas (post 2012), which are updated throughout the season to include new burn areas. The home button in the top left corner resets the map to the original zoom.