Issue Date: Saturday, June 30th, 2018
Issue Time: 9:30 AM MDT
Summary:
The upper-level ridge was knocked down a bit yesterday by a passing shortwave and the approach of a larger-scale upper-level trough. This allowed for high temperatures to come down by a few degrees compared to Thursday’s records, which was a welcome relief. The shortwave acted as a trigger during the afternoon and evening hours, setting off scattered high-based showers/thunderstorms over/near the higher terrain where orographic effects aided lift, but a lack of moisture resulted in very little (if any) rainfall. Another area of showers/thunderstorms was driven by surface convergence along a lee trough over the eastern plains. To the east of this boundary, and near the eastern CO state line, dewpoints were able to climb into the 50s and near 60 F, providing fuel for a few high-based thunderstorms that were able to produce a little bit of rainfall (less than 0.25 inches) and plenty of gusty winds. The strongest wind reports from yesterday were:
3 miles E of Firstview (Cheyenne County): 52 mph wind gust
3 miles E of Sheridan Lake (Kiowa County): Several telephone poles blown down from MM 192-197 on Highway 96.
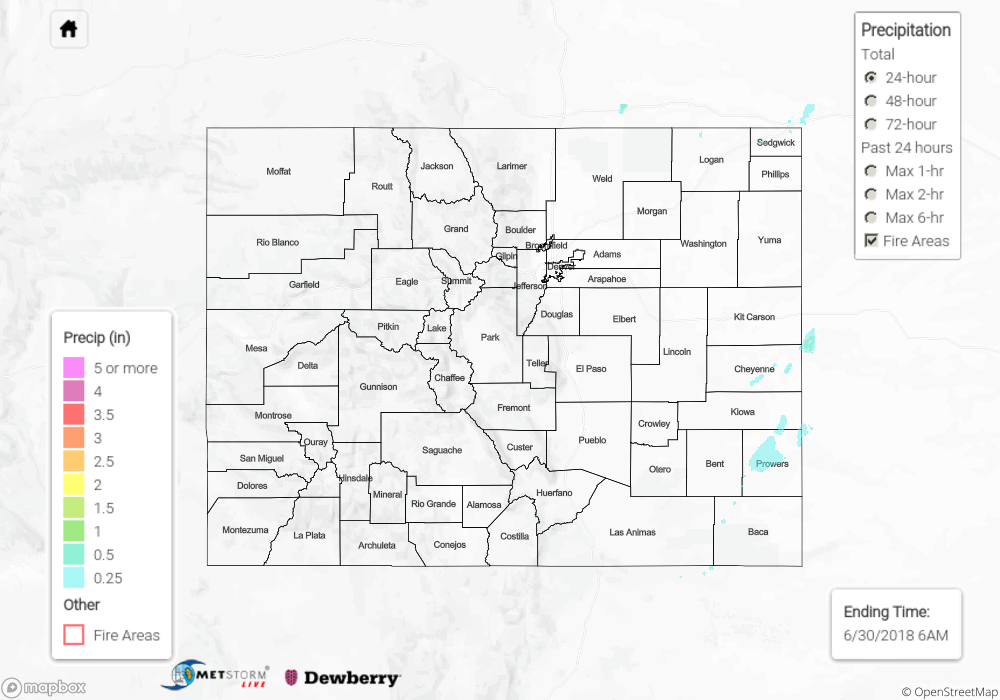
No flash flooding occurred yesterday. For a look at precipitation estimates in your area, please see our State Precipitation Map below.
Click Here For Map Overview