Issue Date: Sunday, July 1st, 2018
Issue Time: 9:30 AM MDT
Summary:
The anticipated upper-level trough moved across the Rockies yesterday, bringing with it cooler temperatures and broad support for the development of scattered showers and thunderstorms. Upslope flow transported good surface moisture into eastern Colorado, providing the fuel for wetting rains and the wind shear necessary for a few strong-to-severe thunderstorms. Severe storm reports to the National Weather Service are as follows:
60 mph thunderstorm wind gust: 7 miles of Heartstrong (Yuma County), 7 miles SW of Idalia (Yuma County), 2 miles NNW of Hale (Yuma County)
58 mph thunderstorm wind gust: 2 miles NNW of Hale (Yuma County)
1.75 inch hail: 7 miles SW of Idalia (Yuma County)
1.50 inch hail: 3 miles N of Colorado Springs (El Paso County), 7 miles S of Idalia (Yuma County), 6 miles W of Bonny Reservoir (Yuma County)
1.25 inch hail: 4 miles NNW of Peterson AFB (El Paso County)
…and a smattering of 1 inch hail reports from El Paso County, Weld County, and Larimer County.
The bulk of shower/thunderstorm activity occurred during the afternoon and early evening hours, along and east of I-25. A second round of thunderstorms developed over the Palmer Ridge, southern portions of the Northeast Plains, and Southeast Plains after 8 PM. This line of storms drifted slowly south-southeastward, diminishing/exiting the state during the early morning hours.
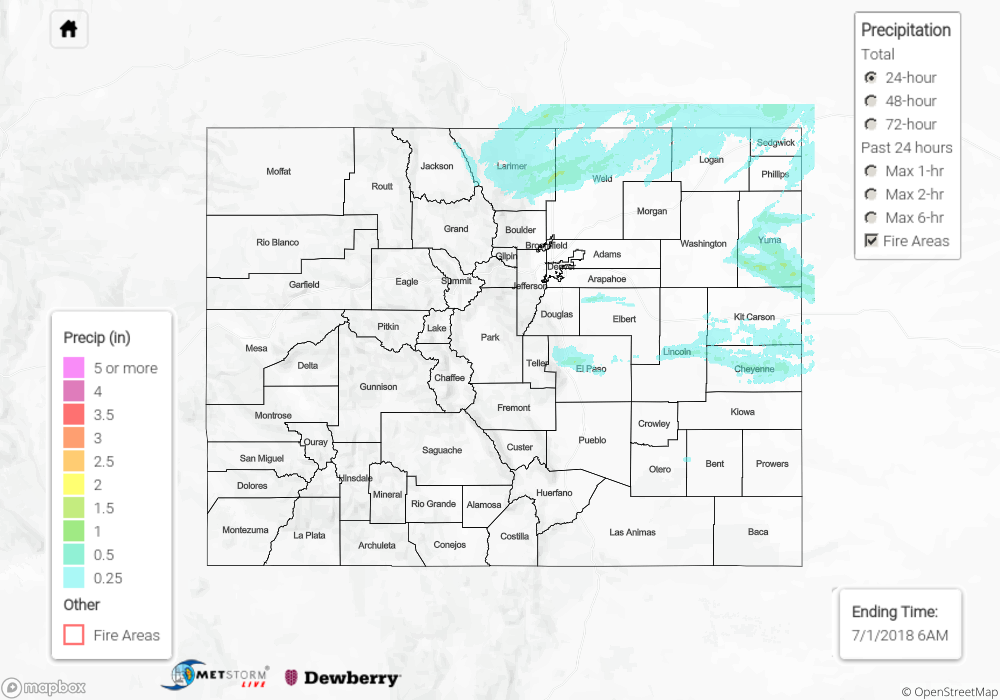
No flash flooding occurred yesterday. For a look at precipitation estimates in your area, please see our State Precipitation Map below.
Click Here For Map Overview
The map below shows radar-estimated, rainfall gage-adjusted Quantitative Precipitation Estimates (QPE) across Colorado. The map is updated daily during the operational season (May 1 – Sep 30) by 11AM. The following six layers are currently available: 24-hour, 48-hour and 72-hour total precipitation, as well as maximum 1-hour, 2-hour and 6-hour precipitation over the past 24 hour period (to estimate where flash flooding may have occurred). The 24-hour, 48-hour and 72-hour total precipitation contain bias corrections that are not disaggregated into the hourly estimates, so there will likely be some differences. The accumulation ending time is 6AM of the date shown in the bottom right corner. Also shown optionally are fire burn areas (post 2012), which are updated throughout the season to include new burn areas. The home button in the top left corner resets the map to the original zoom.