Issue Date: Friday, June 29, 2018
Issue Time: 09:30AM MDT
Summary:
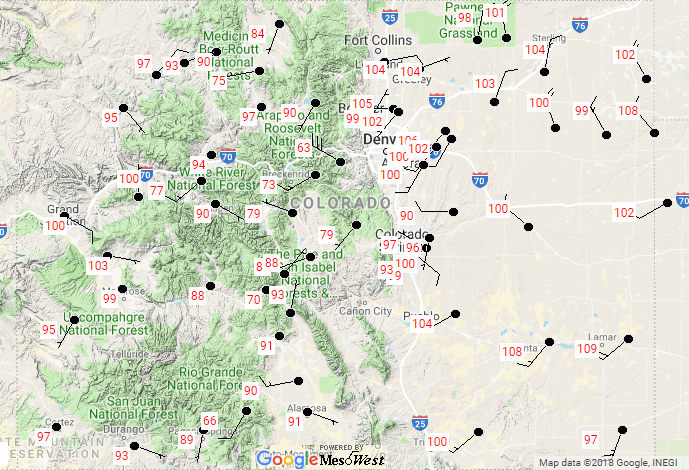
Yesterday, the strong ridge continued to build and under that ridge, record heat occurred. The high in Denver reach 105F by 3PM, which ties the all-time record set in 1878, 2005 and 2012 (x2) . Several other cities recorded their highest temperature ever for June 28th including Greeley and Fort Collins. The highest recorded temperature over the last 24-hours was in Lamar where it reached 109F! The Southeast Plains are expected to break the 100F mark again today.
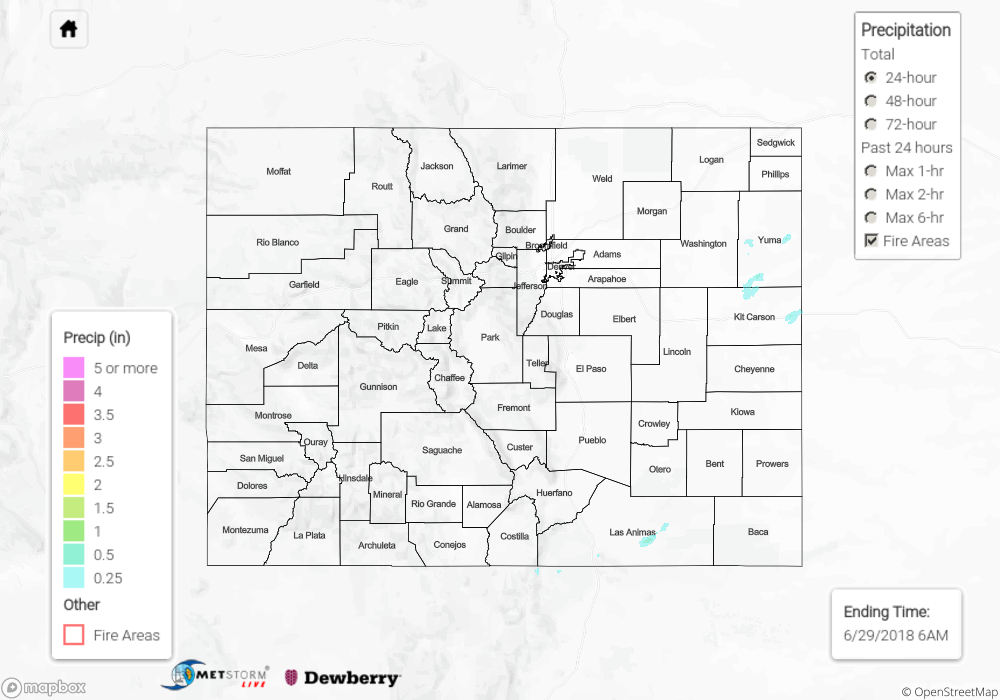
As forecast, not much low-level moisture was available for rainfall yesterday, so instead there were a lot of mid-level clouds in the afternoon as the atmosphere reached the convective temperature. A couple stronger thunderstorms formed over the eastern plains and Raton Ridge along a line of convergence. Max 1-hour rain rates were estimated just over 0.5 inches and strong wind gusts were recorded. A gust of 74mph was measured at Lamar Airport with several other areas receiving gusts between 45-60 mph. The breezy conditions were not helpful to the fires that continue to burn across the state. Storms quickly came to an end after the sunset when the instability rapidly dropped off.
To see how much precipitation fell in your area yesterday, scroll down to the State Precipitation Map below.
Click Here For Map Overview