Issue Date: Friday, July 6th, 2018
Issue Time: 11:00 AM MDT
Summary:
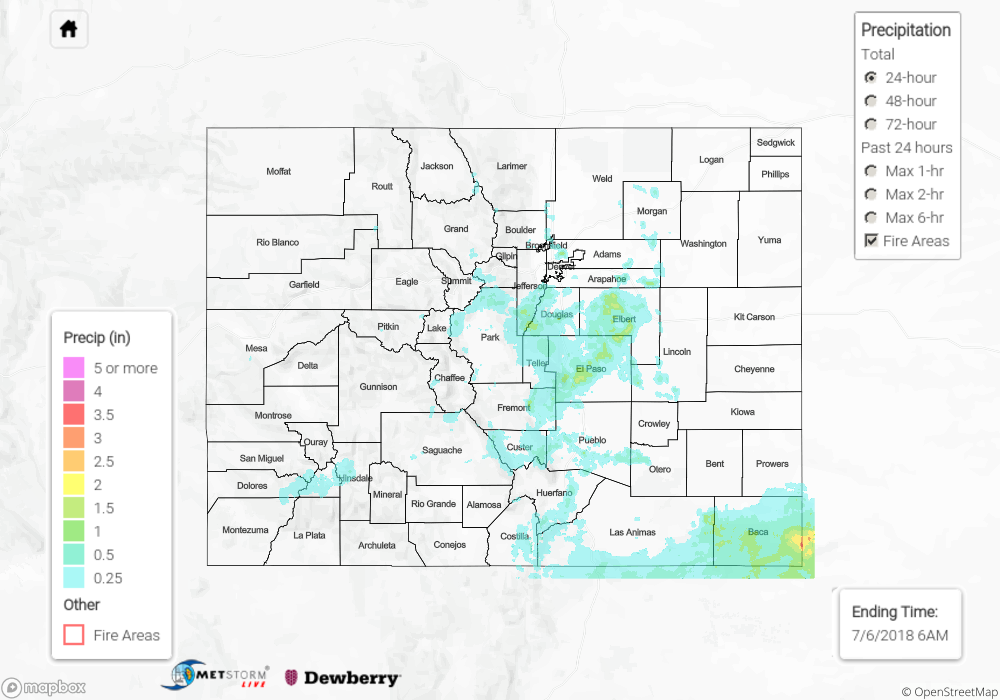
It was a very humid day for many in Colorado on Thursday, with dewpoints near 60°F in many locations across the plains. As expected, this led to an outbreak of strong storms with some heavy rain across the Central Mountains, Palmer Ridge, Southeast Mountains, and Southeast Plains, in some cases providing a major boost to firefighting efforts. The Spring Creek, Weston Pass, Adobe, and Chateau fires all received a bit of much-needed rain, although flooding and mud flows were fortunately not reported. There was even a rare high country tornado reported, with video and pictures circulating of a tornado in Park County, not far from the Weston Pass fire!
Perhaps even more impressive were the storms that developed yesterday evening along the Rampart Range and Pike’s Peak. Rainfall reports were widely in the 0.25” to 1.50” range around the Colorado Springs metro area, per CoCoRaHS this morning. An amazing 4.33” was reported 3.2 miles north of Fountain, CO, although this may be of questionable validity given the lack of flood reports. Other top reports from around the state include the following:
- 2.57” at Stonington (8.6 SE), Baca County
- 2.27” at Canon City (0.7 SSE), Fremont County
- 1.61” at Kiowa (12.7 ENE), Elbert County
Surprisingly, flooding was not reported on Saturday, although no doubt there was minor street flooding and field ponding under those strongest storms. For rainfall estimates in your area, check out our State Precipitation Map below.
Click Here For Map Overview
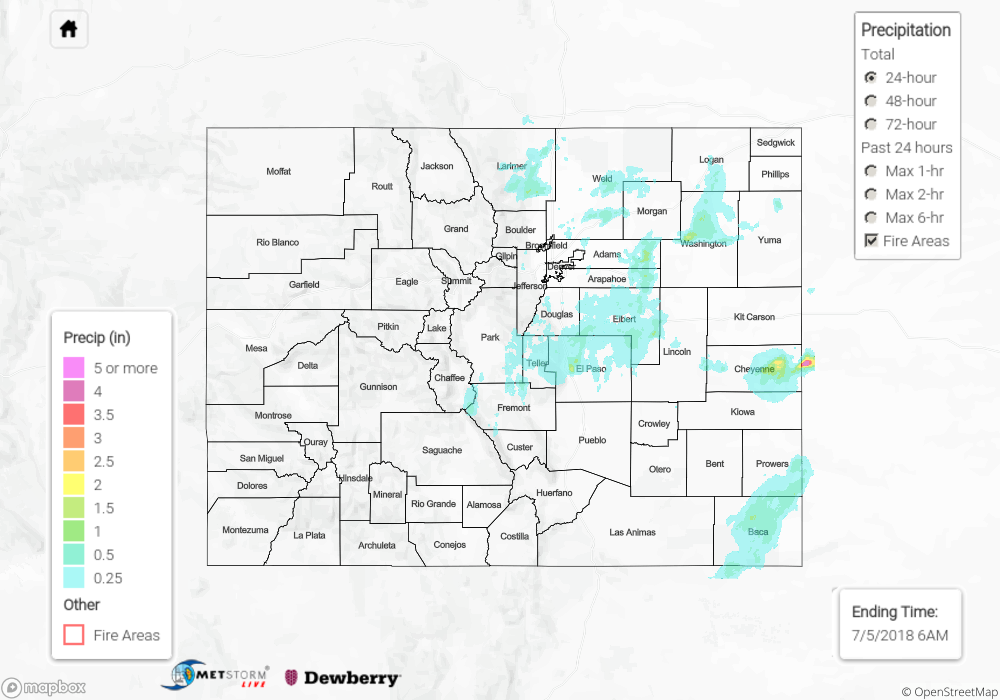
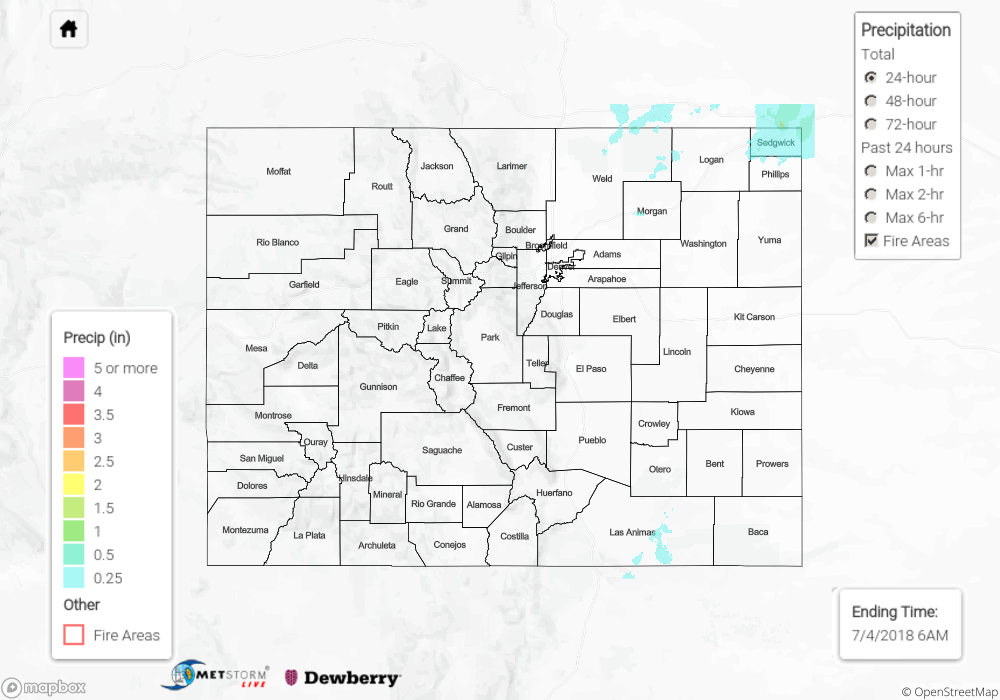
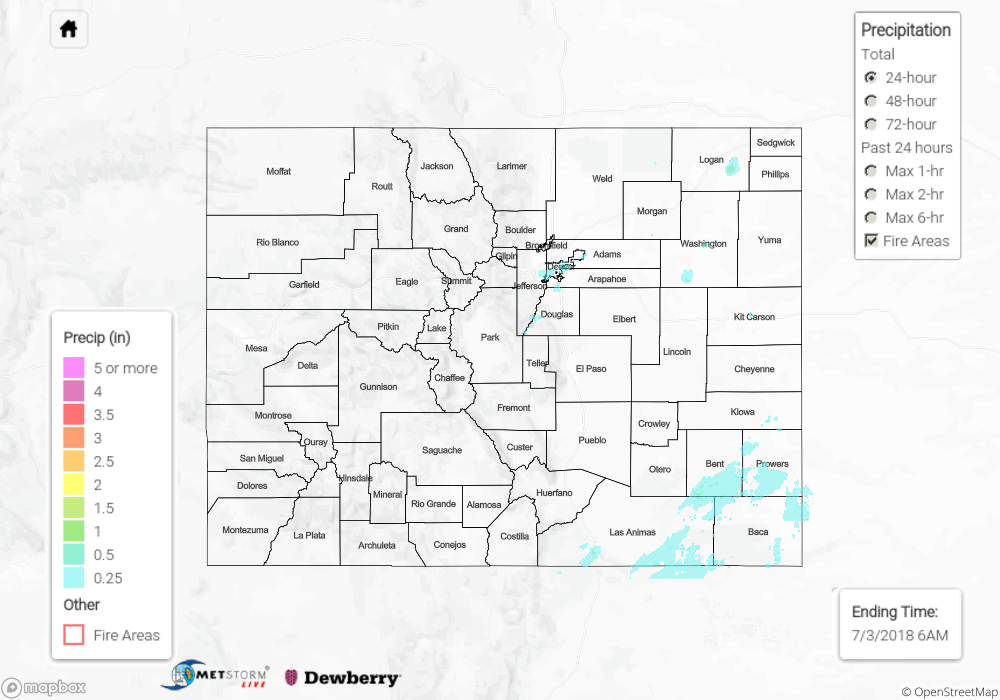
The map below shows radar-estimated, rainfall gage-adjusted Quantitative Precipitation Estimates (QPE) across Colorado. The map is updated daily during the operational season (May 1 – Sep 30) by 11AM. The following six layers are currently available: 24-hour, 48-hour and 72-hour total precipitation, as well as maximum 1-hour, 2-hour and 6-hour precipitation over the past 24 hour period (to estimate where flash flooding may have occurred). The 24-hour, 48-hour and 72-hour total precipitation contain bias corrections that are not disaggregated into the hourly estimates, so there will likely be some differences. The accumulation ending time is 6AM of the date shown in the bottom right corner. Also shown optionally are fire burn areas (post 2012), which are updated throughout the season to include new burn areas. The home button in the top left corner resets the map to the original zoom.