Issue Date: Tuesday, July 3, 2018
Issue Time: 09:25 AM MDT
Summary:
For the most part, Colorado stayed pretty dry yesterday as arid and warm desert southwest air limited atmospheric moisture available for afternoon thunderstorms. The first afternoon storms fired over the Raton Ridge by 1:30 PM. These storms did not produce much rainfall with dew points behind the dry line close to 30F. A bit later, a line of convection popped up along the dry line over the Southeast Plains. Fast moving storms and drier lower levels kept rainfall amounts below flood threat criteria and produced some gusty winds. An ASOS near Lamar reported a gust of 62 mph around 4:30 PM. Radar rainfall estimates were up to 0.5 inches/hour with a CoCoRaHS station south of Kim recording 0.33 inches. Elsewhere, a couple garden variety thunderstorms were able to move off the mountains into the more moist Northeast Plains air. The heavier rainfall was very localized, thus no flooding was reported. Lastly, a some thunderstorms initiated along a boundary over Denver at 9 PM. The highest reporting ALERT gage was over Aurora where 0.55 inches of rain fell. Generally speaking, rain totals were only in the 0.2-0.3 inch range, but it was a welcomed surprise for all the Metro area lawns.
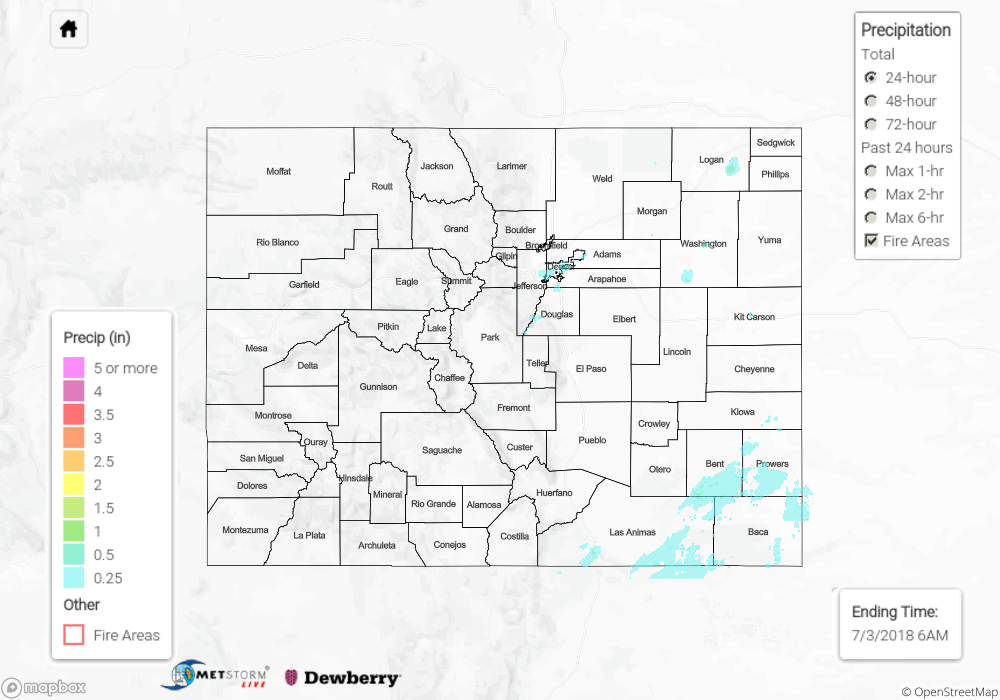
Flooding was not reported on Monday. To see how much precipitation fell in your area, scroll down to the State Precipitation Map below.
Click Here For Map Overview