Issue Date: Wednesday, July 4th, 2018
Issue Time: 9:30 AM MDT
Summary:
Yesterday started with abundant sunshine and blue skies across the majority of the state as high pressure built over the region, allowing temperatures to climb quickly during the morning hours. An upper-level disturbance rounded the high pressure ridge and impacted Colorado during the afternoon/evening hours, triggering isolated showers/thunderstorms. The best moisture, relatively speaking, resided in northeast Colorado, where dewpoints in the 50s provided fuel to the best couple of storms of the day. The strongest storm produced one severe wind report of 59 mph, 9 miles WNW of Westplains (Weld County).
Overall, the atmosphere was very dry below 500 mb, and most showers/storms resulted in virga and gusty winds with very little rainfall reaching the surface. No flash flooding occurred yesterday. For a look at precipitation estimates in your area, please see our State Precipitation Map below.
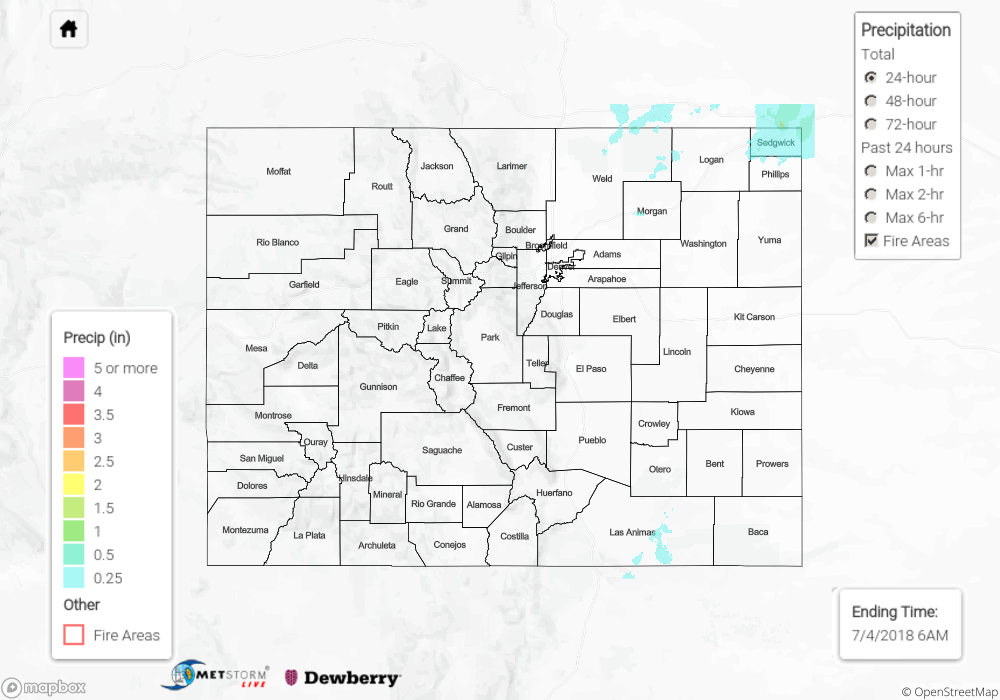
Click Here For Map Overview
The map below shows radar-estimated, rainfall gage-adjusted Quantitative Precipitation Estimates (QPE) across Colorado. The map is updated daily during the operational season (May 1 – Sep 30) by 11AM. The following six layers are currently available: 24-hour, 48-hour and 72-hour total precipitation, as well as maximum 1-hour, 2-hour and 6-hour precipitation over the past 24 hour period (to estimate where flash flooding may have occurred). The 24-hour, 48-hour and 72-hour total precipitation contain bias corrections that are not disaggregated into the hourly estimates, so there will likely be some differences. The accumulation ending time is 6AM of the date shown in the bottom right corner. Also shown optionally are fire burn areas (post 2012), which are updated throughout the season to include new burn areas. The home button in the top left corner resets the map to the original zoom.